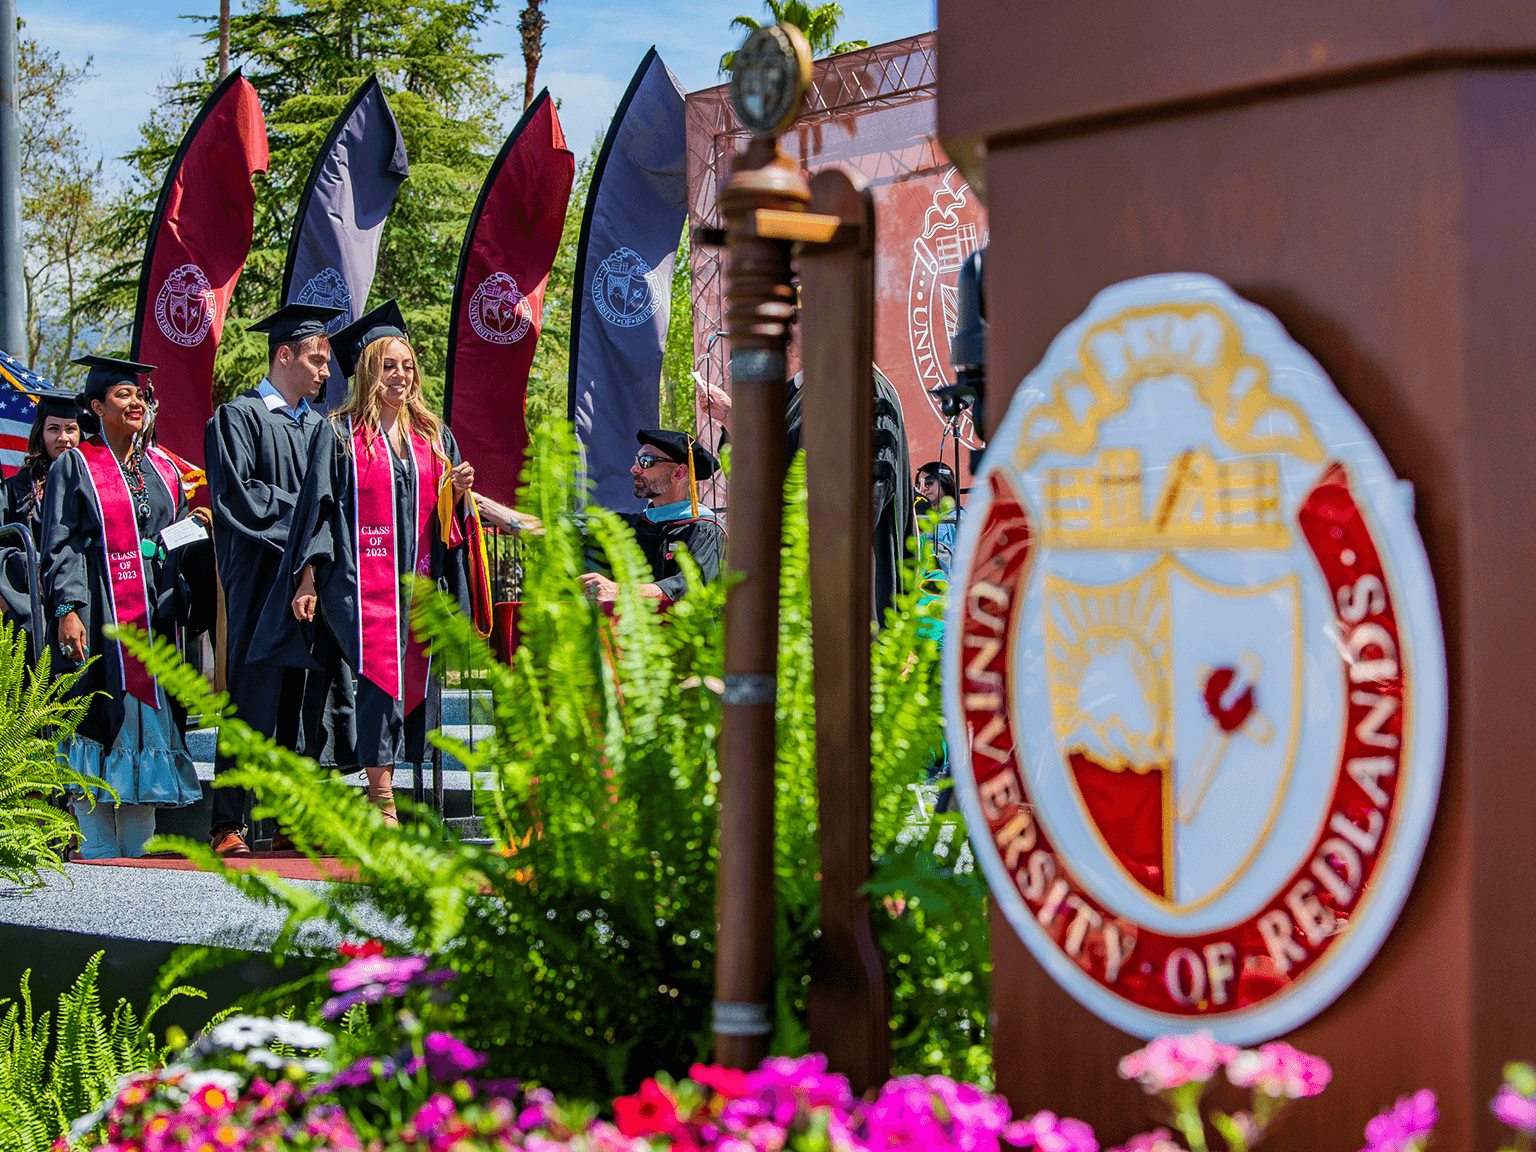

San Francisco Theological Seminary
For over 150 years, San Francisco Theological Seminary (SFTS) has provided a rigorous, theological education rooted in the Reformed tradition, renewed daily through dialogue, critical inquiry, and practical reflection.
Explore academic programs
SFTS degree programs are framed by a classical theology curriculum of scripture, history, systematic theology, ethics, homiletics, and pastoral care.
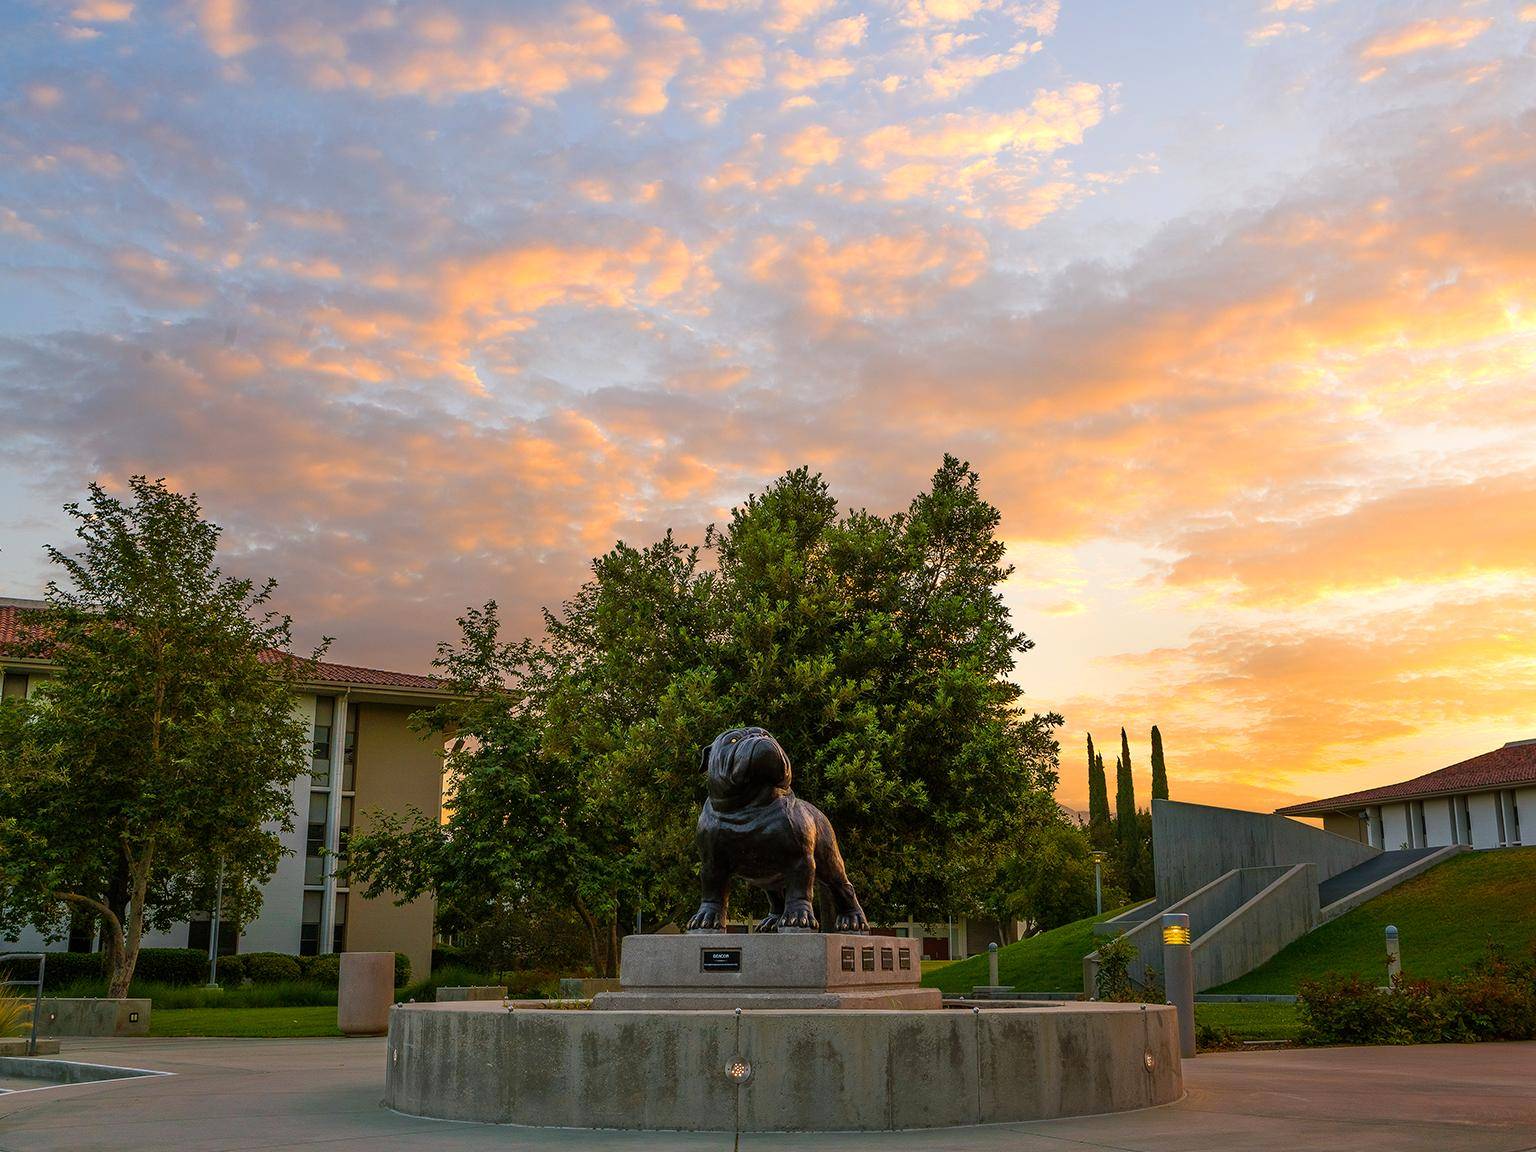
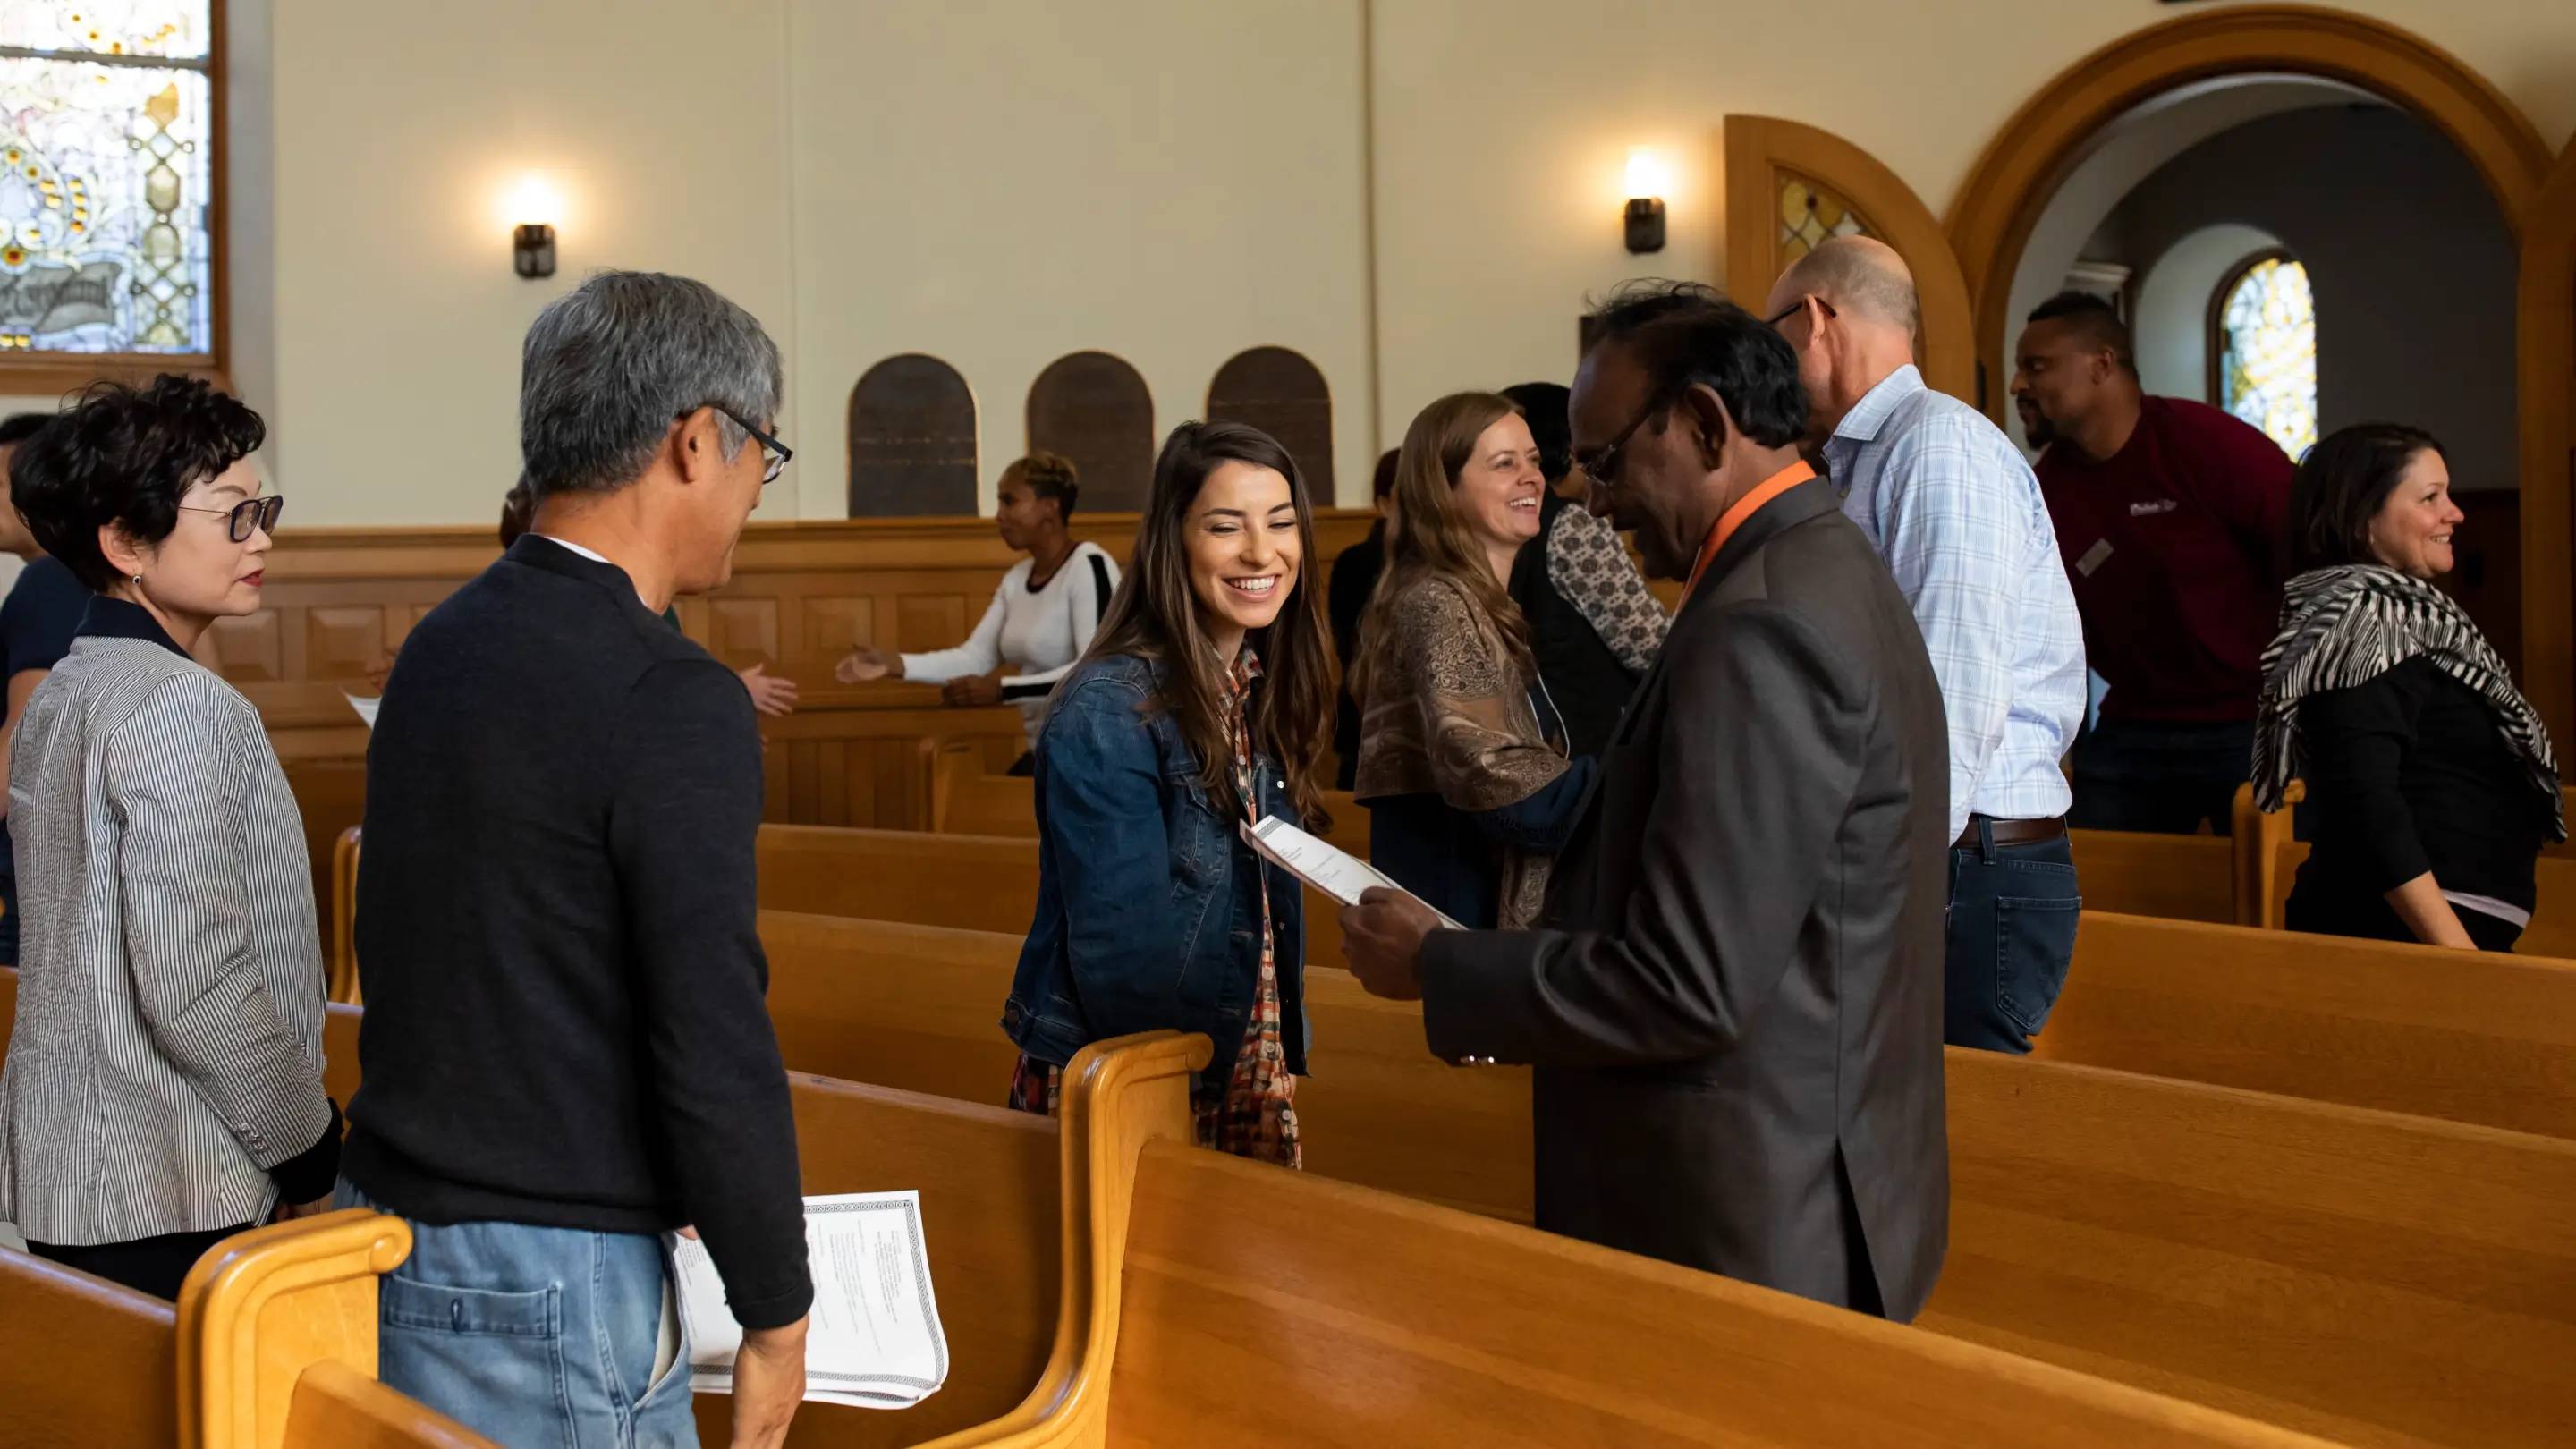
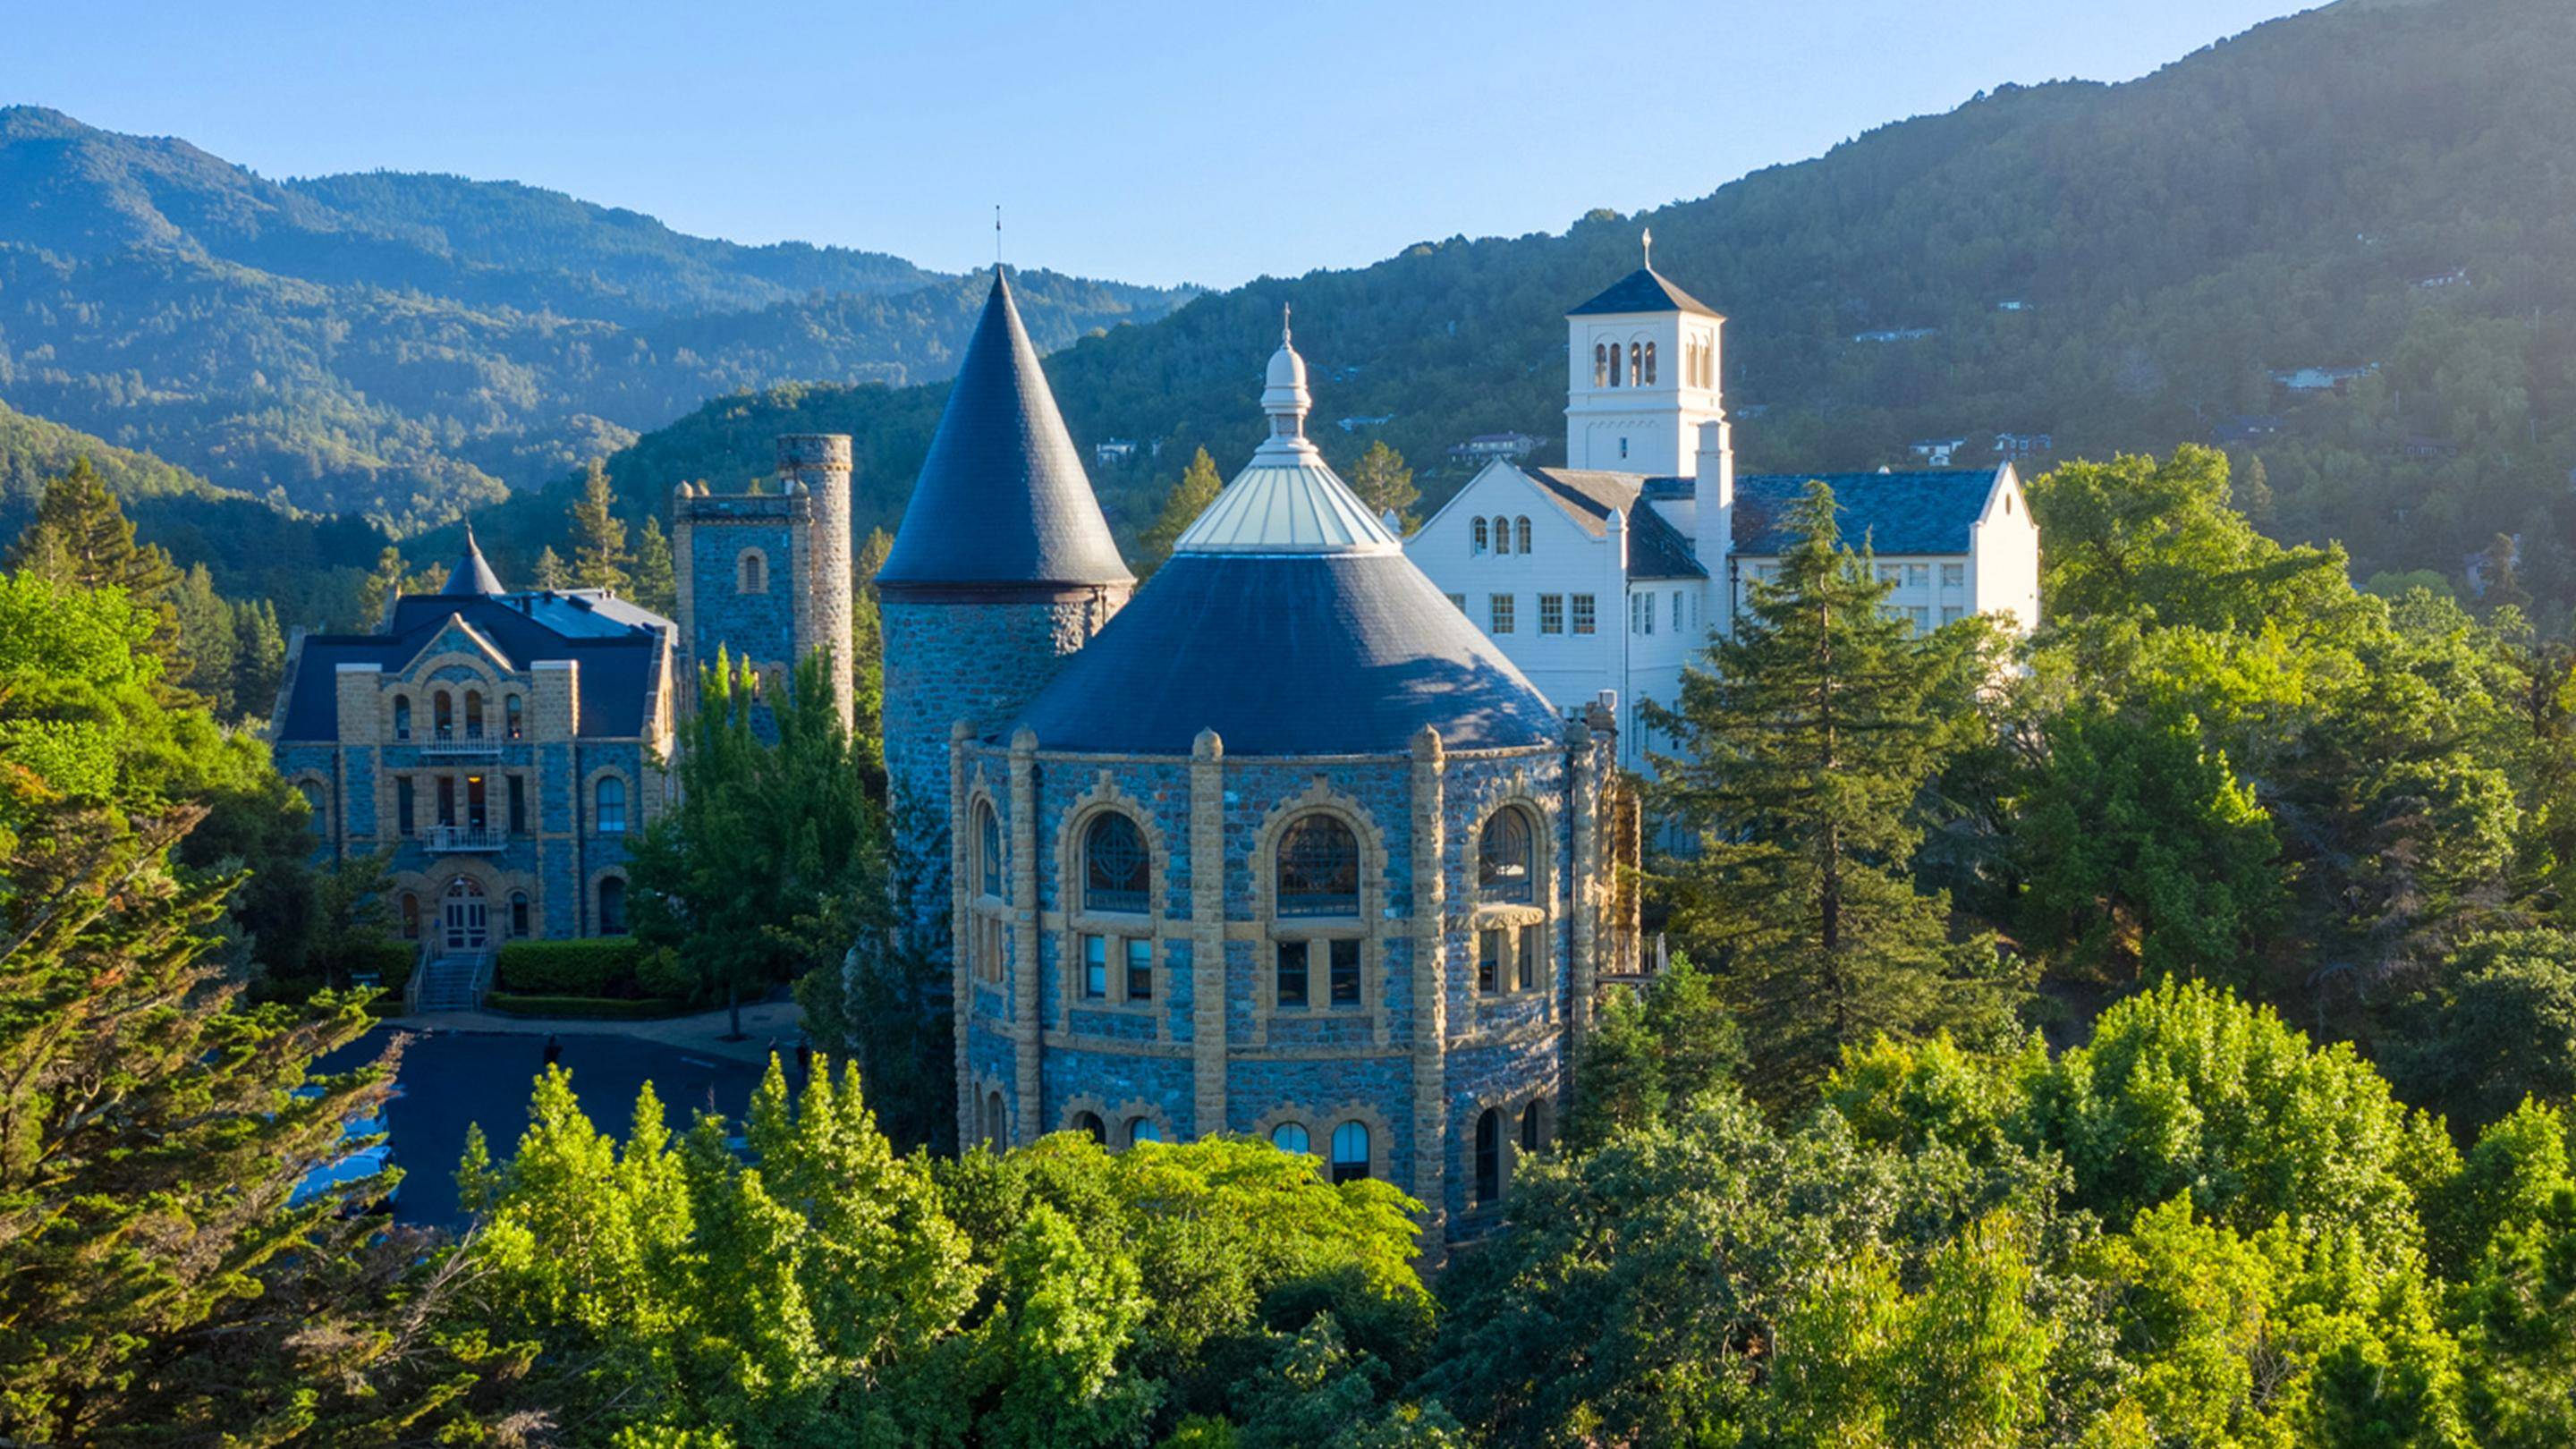
Enhance your spirituality on our Bay Area campus

Enhance your spirituality on our Bay Area campus
Rooted in the Bay Area for over 150 years, our serene Bay Area campus lies nestled in the hills of San Anselmo—a quaint, historic town just 15 miles north of San Francisco. These grounds get you to be curious and reflect. An SFTS student experience on these sacred grounds provides an opportunitiy to explore reflection and curiousity through an ecumenical education. Through the consortium partnership with Graduate Theological Union, students have access to an education beyond the classroom.
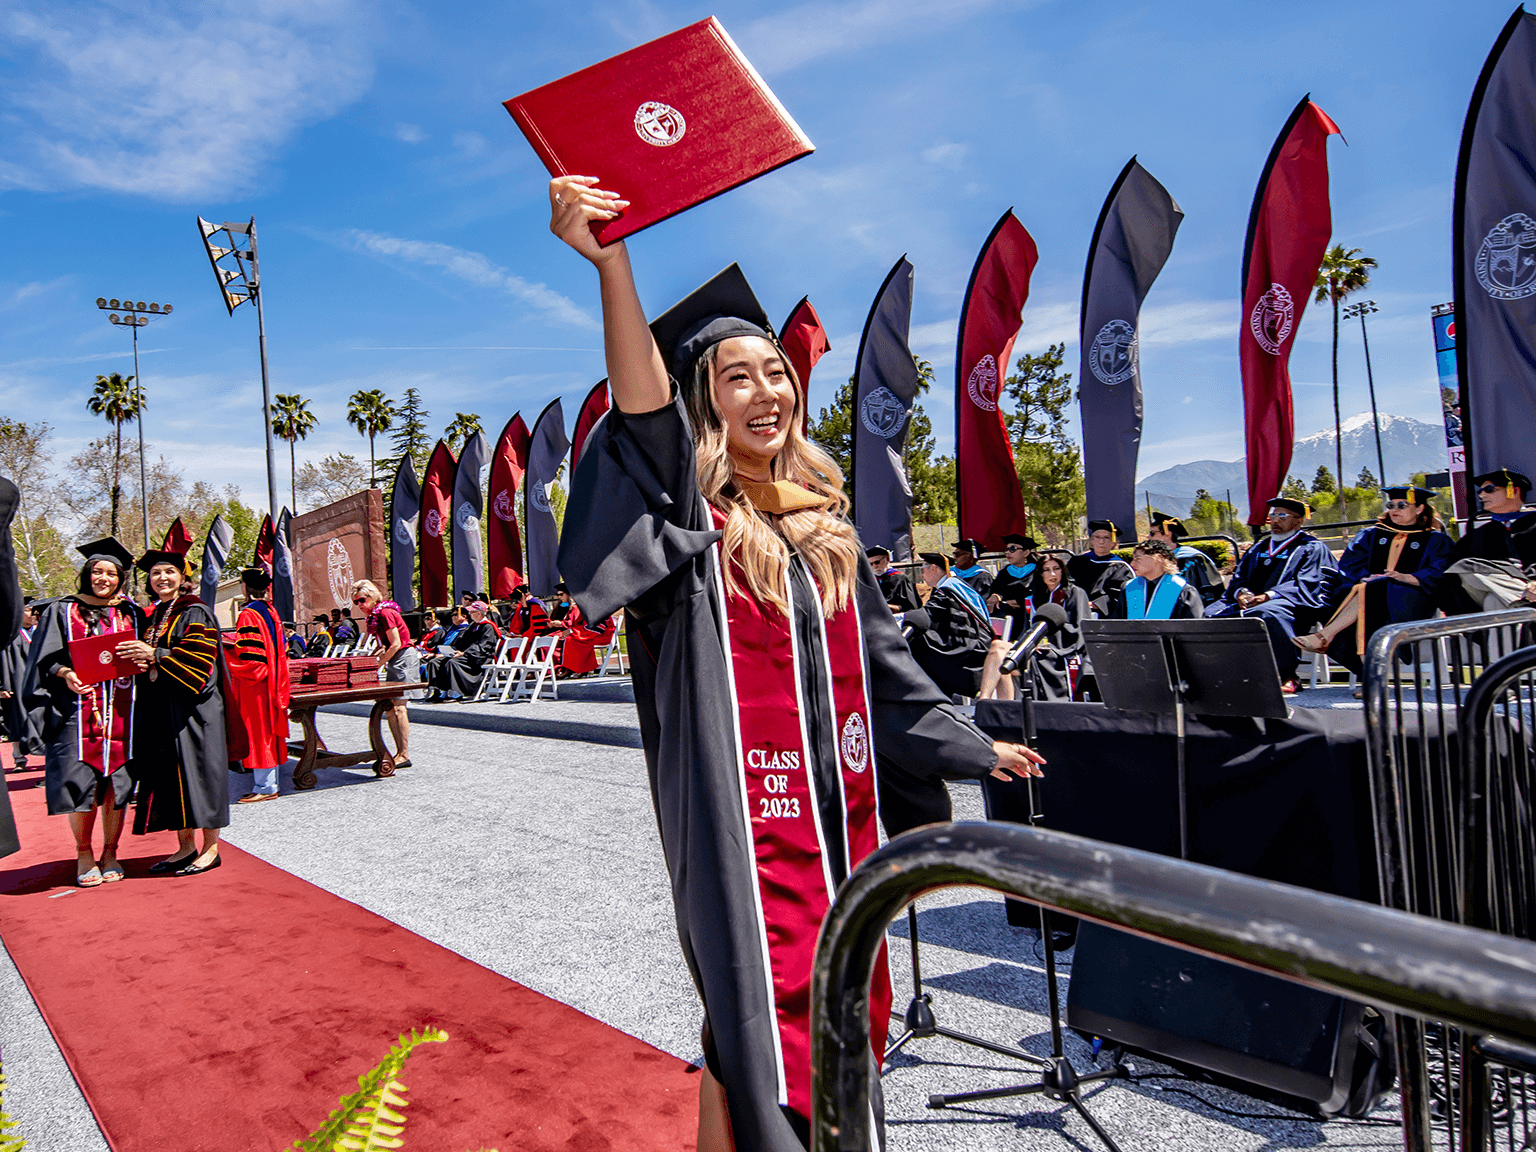
Challenge assumptions • Redefine ministry • Build community
SFTS prepares students for deep theological engagement, transformational impact, and active leadership in public life.
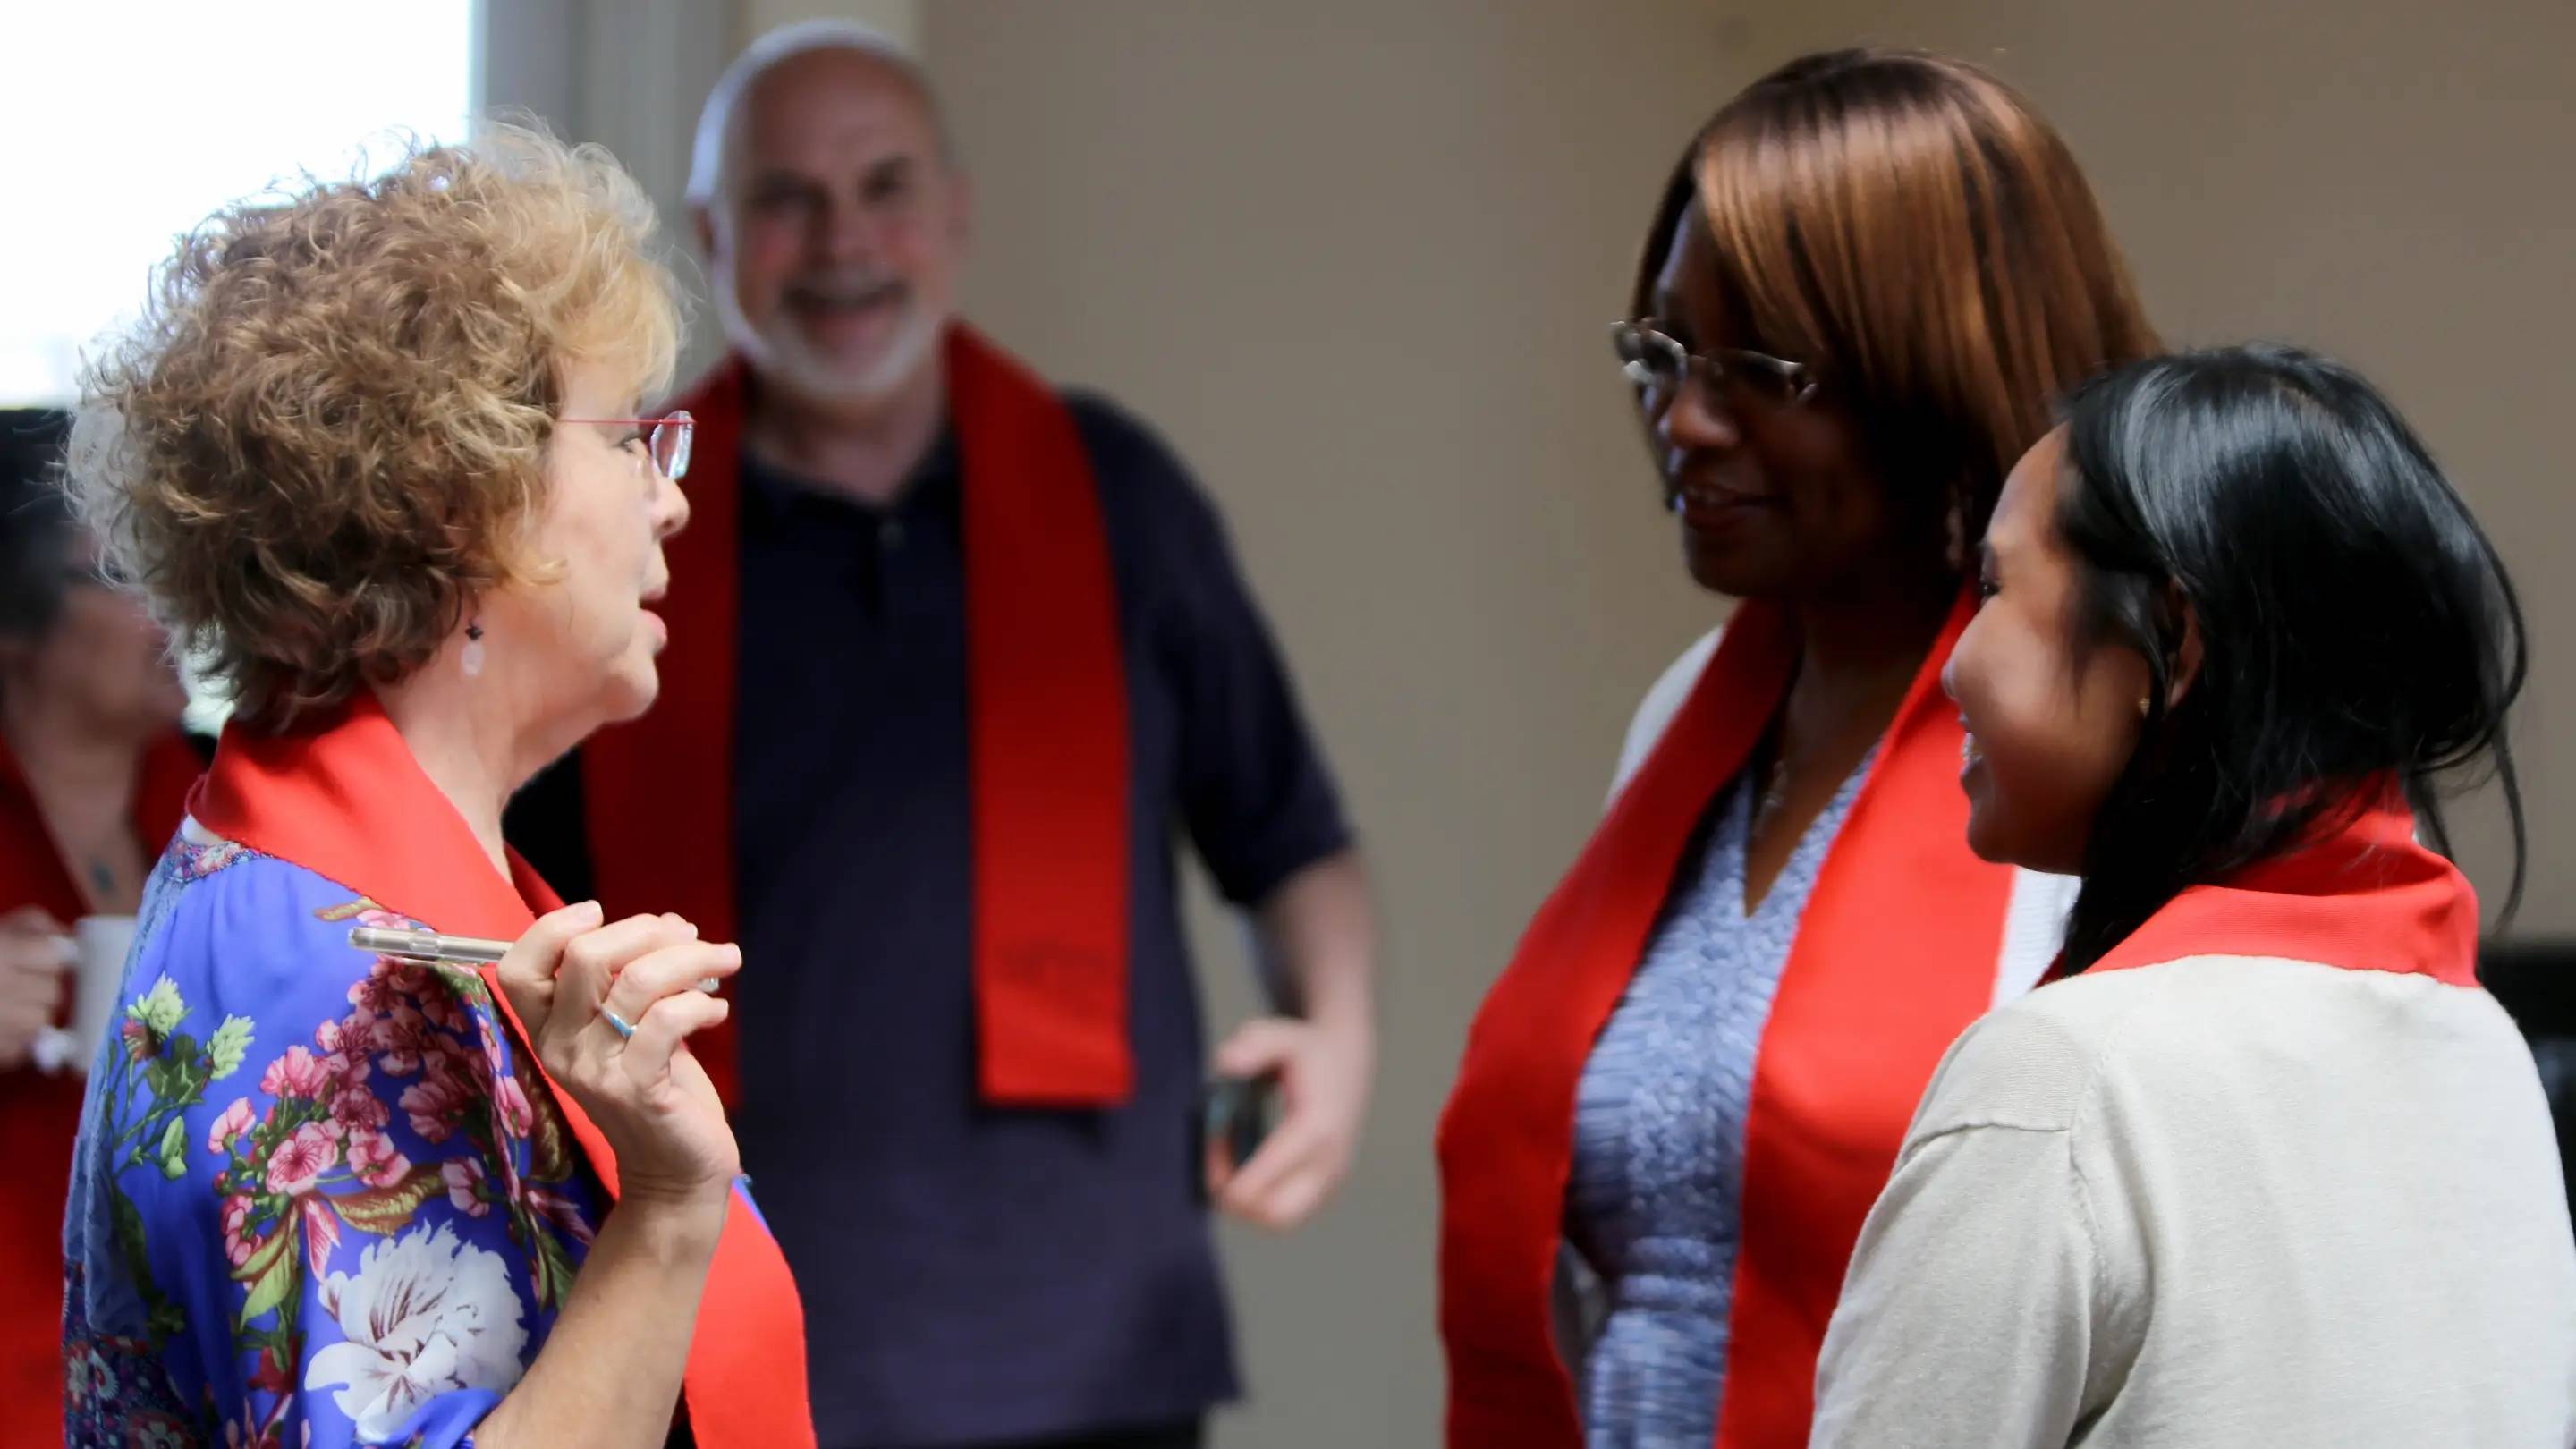
Shaw Chaplaincy Institute
All Shaw Chaplaincy Institute programs foster an understanding of how caring practices are expressed across cultures and religious traditions and contribute to multiple dimensions of interreligious thought, faith, life, and witness in the world.
Clinical Pastoral Education
San Francisco Theological Seminary at University of Redlands offers ACPE-accredited Clinical Pastoral Education at Level I, II, and Supervisory levels through the Shaw Chaplaincy Institute.
Spiritual Programs
San Francisco Theological Seminary at University of Redlands offers a 30-year-old Diploma and Certificate in Spiritual Direction — ACPE-accredited programs combining study, supervised practice, and spiritual formation.

Academic support and resources
Students receive comprehensive support through tailored academic advising, career counseling, and pastoral care, fostering both personal and professional growth. The nurturing community emphasizes spiritual development and a commitment to social justice.
Meet SFTS faculty
Every Redlands faculty member is an active practitioner in their field, integrating both theory and practical application into their teaching. Deep passion for their subjects drives their commitment to student learning.

Rev. Laurie Garrett-Cobbina
Dean, San Francisco Theological Seminary

Rev. Paul Gaffney
Program Manager of Education, Community Relations, and Spiritual Care Services; ACPE Certified Educator Shaw Chaplaincy Institute

Wendy Farley
Director, Program in Christian Spirituality, Rice Family Professor of Spirituality

Julius Bailey
H. Eugene Farlough-California Chair in African-American Christianity, Religious Studies

John P. Falcone
Ford Visiting Professor of Practical Theology

Gregory Love
Associate Professor

Eugene Eung-Chun Park
Dana and David Dornsife Professor of New Testament

Teresa Chávez Sauceda
Professor

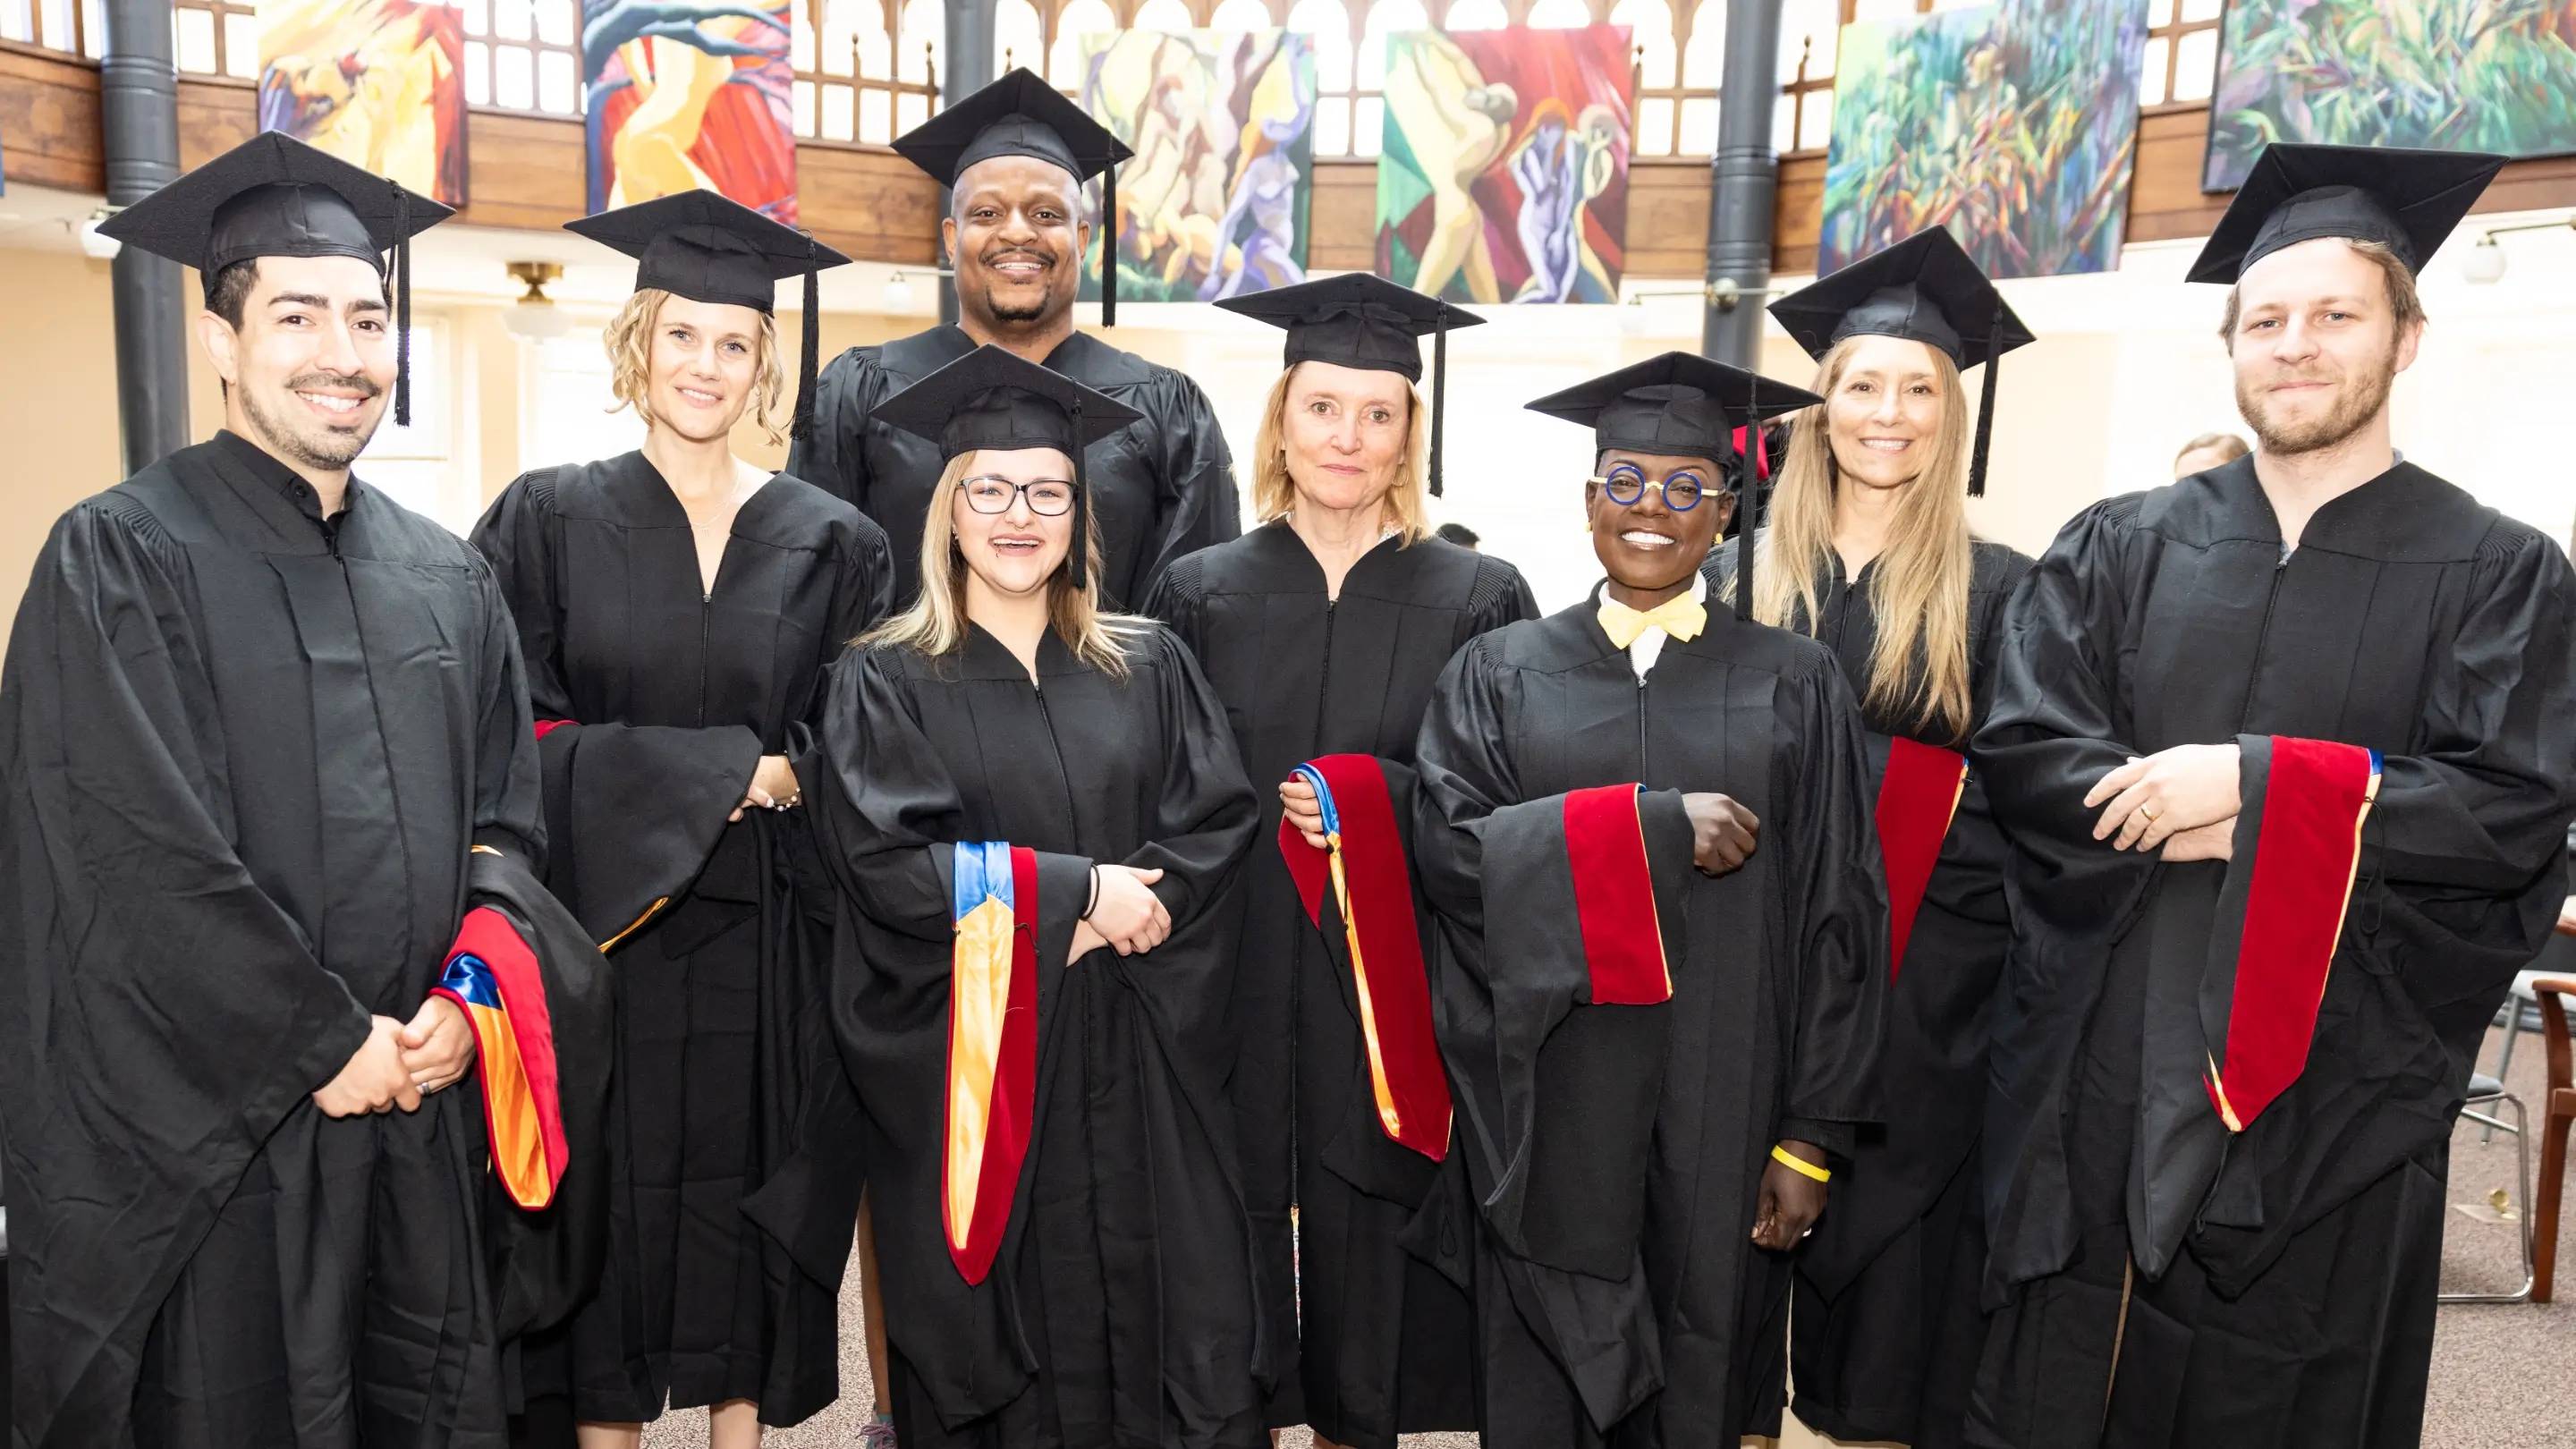
Celebrating over 150 years
Learn more info about our connected as an SFTS alumni community and resources.
Learn more about SFTS
San Francisco Theological Seminary is housed at the San Francisco Bay Area campus. Get to know the SFTS faculty and staff.
Contact

Take your next steps
Seize the endless opportunities and pursue your future at University of Redlands.