
Leading GIS education and innovation at Redlands
With deep industry roots and a vision for change, Redlands prepares professionals to lead the next generation of geospatial transformation.

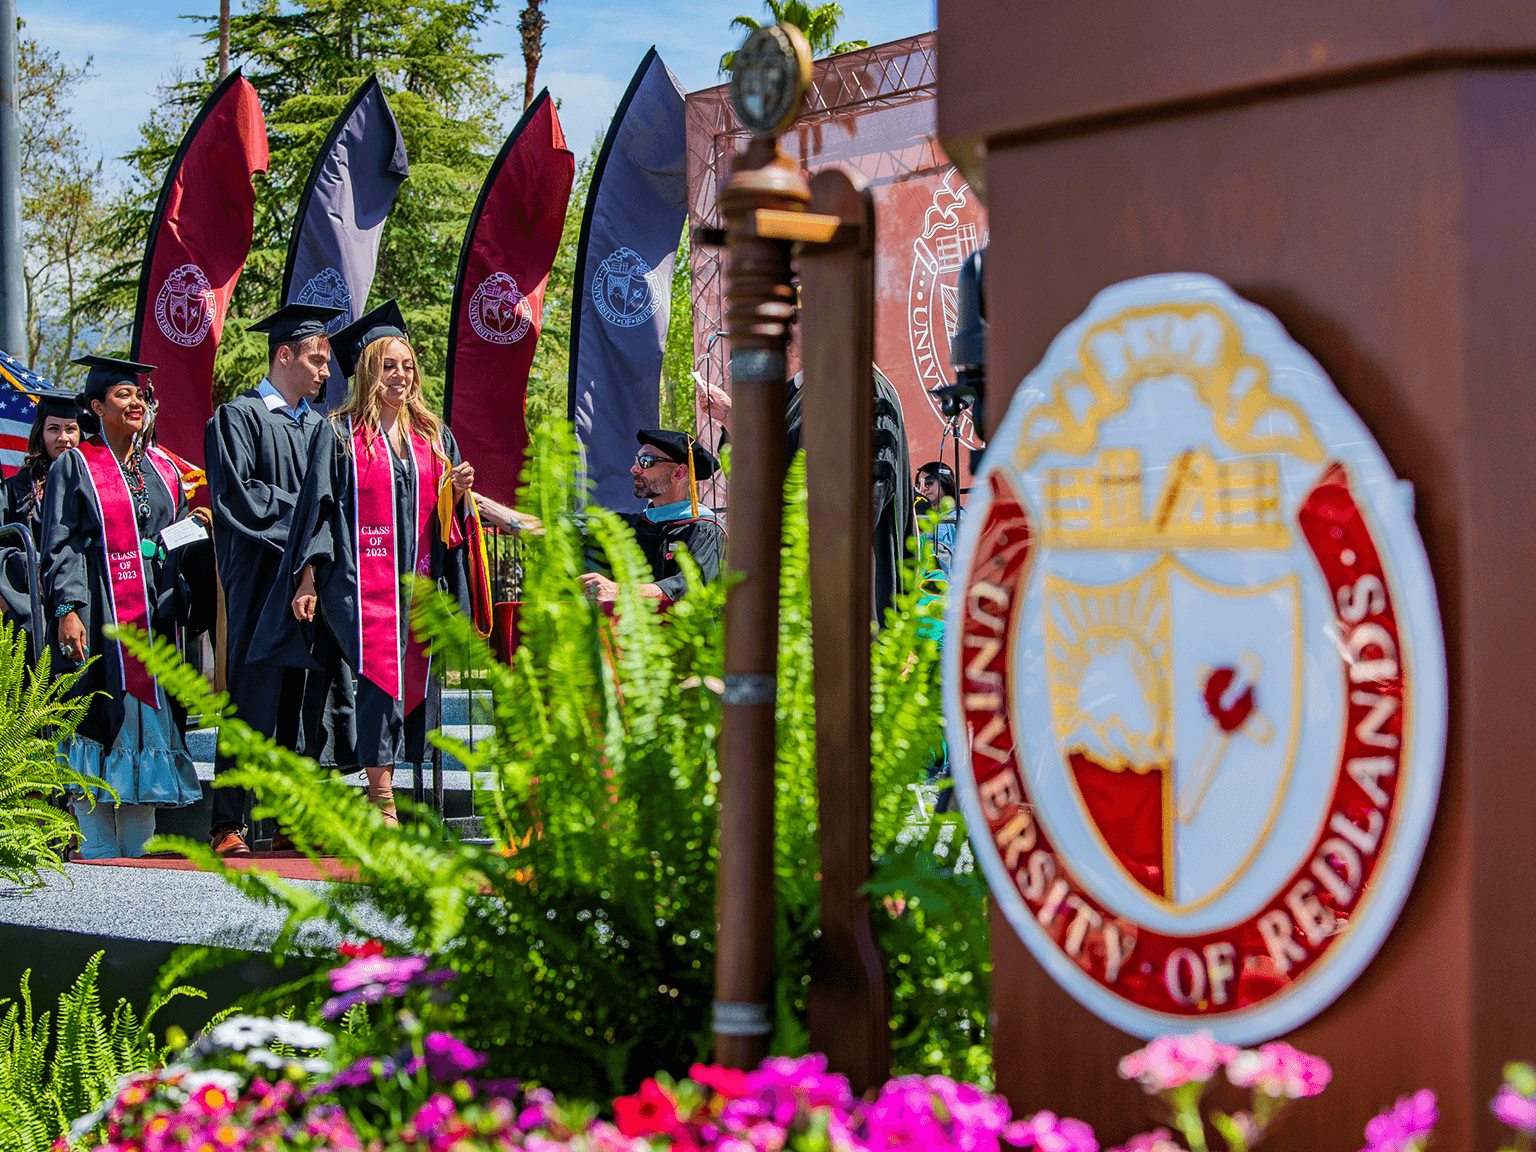
At the Center of GIS
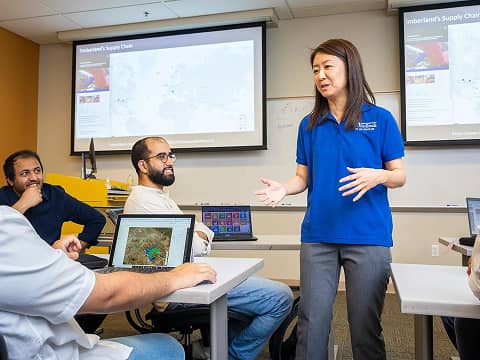
University of Redlands is more than just a leader in GIS education—it’s at the Center of GIS. Located in Redlands, California, the epicenter of the geospatial industry and home to Esri, the world’s leading GIS software company, our university provides unparalleled access to industry resources, partnerships, and career pathways.

Empowering the next generation of GIS leaders
Redlands offers a portfolio of nationally recognized GIS programs led by expert faculty and practitioners who leverage GIS to create meaningful impact in organizations and communities—and prepare our students to do the same. Whether you’re just beginning your GIS journey or advancing your knowledge and expertise, Redlands is the place to be for hands-on learning, impactful projects, and transformative experiences that empower you to think big and create change. We’re driven by the belief that spatial thinking can transform the world, and we infuse that excitement into everything we do.
Map your future in GIS your way on-campus, hybrid, and online
Whether you’re a professional interested in a master’s or certificate, or a student seeking a bachelor’s degree as you begin your GIS journey, we offer on-campus, hybrid, and online programs to help you reach your goals. To learn more or apply, view the programs below.
Master of GIS
Designed for professionals and recent graduates seeking to deepen their expertise in analyzing, managing, and communicating geographic information.

Master of Science in GIS
Combines the development of strong technical skills and in-depth understanding of geographic information systems and theory. Students will work with a client and apply their skills to identify, design, implement, and present a GIS solution to solve a real-world problem with their Major Individual Project.• On Campus, Online | STEM-designated
Master of GIS
Designed for professionals and recent graduates seeking to deepen their expertise in analyzing, managing, and communicating geographic information. It emphasizes technical skills, theoretical knowledge, and includes a professional internship to apply GIS in real-world settings.• On Campus, Online | STEM-designated

Executive Master of GIS
Designed for mid- to senior-level professionals aiming to lead GIS-driven organizations. It combines technical, methodological, strategic, and leadership training to support effective GIS management across sectors.• Online | STEM-designated | Business
MBA with Location Analytics concentration
Trains professionals to solve business problems using spatial analytics. Students build flexible skills in geographic approaches to business analysis and apply them in a capstone project focused on strategy or consultancy, culminating in a practical report.• Online | Business
M.S. in Business Analytics
Equips students with business knowledge, analytical skills, and ethical data use to drive informed decisions. The program culminates in a real-world capstone project applying analytics to solve organizational challenges.• Online | STEM-designated
Certificates in GIS

Graduate Certificate in GIS for Public Safety
Focuses on equipping professionals with the skills to apply GIS technology to enhance public safety strategy and operations. • Online | STEM-designated | Business
Graduate Certificate in GIS Project Management
Trains professionals to solve business problems using spatial analytics. Students build flexible skills in geographic approaches to business analysis and apply them in a capstone project focused on strategy or consultancy, culminating in a practical report.• Online | STEM-designated | Business
Graduate Certificate in Geospatial Data Science
Provides a comprehensive foundation in spatial data science, analytics, and programming, tailored for professionals and recent graduates aiming to leverage GIS in their fields and advance their careers.• Online | STEM-designated
Graduate Certificate in GIS
Introduces working professionals to the fundamentals of GIS, including data creation, cartographic presentation, Pyton scripting, and web GIS development. It's ideal for those new to GIS or looking to apply it meaningfully within their field.• On Campus, Online
Graduate Certificate in GIS for Management
Equips professionals to use GIS and location analytics to understand customer behavior, optimize operations, and predict business trends, supporting strategic decisions and sustainable growth.• Online
Bachelors
GIS B.A.
Provides a strong foundation in applied GIS through interdisciplinary learning and real-world case studies. With a focus on career-ready spatial skills, the program supports internship and job preparation and pairs well with a second major.• On Campus
GIS B.S.
Educates students to think, communicate, reason, and solve real-world problems spatially. The curriculum is composed of four key competencies: spatial data acquisition, spatial data management, spatial analysis, and information presentation.• On Campus
Environmental GIS Minor
Enhances Environmental Studies majors with specialized GIS skills for environmental applications, combining core spatial analysis courses with targeted methods and environmental electives.• On Campus
Spatial Studies Minor
Trains professionals to solve business problems using spatial analytics. Students build flexible skills in geographic approaches to business analysis and apply them in a capstone project focused on strategy or consultancy, culminating in a practical report.• Online

Accelerated Geographic Information Science Pathway
Allows students to fast-track their GIS careers by earning a master’s degree within one year of completing their undergraduate degree at Redlands.• On Campus
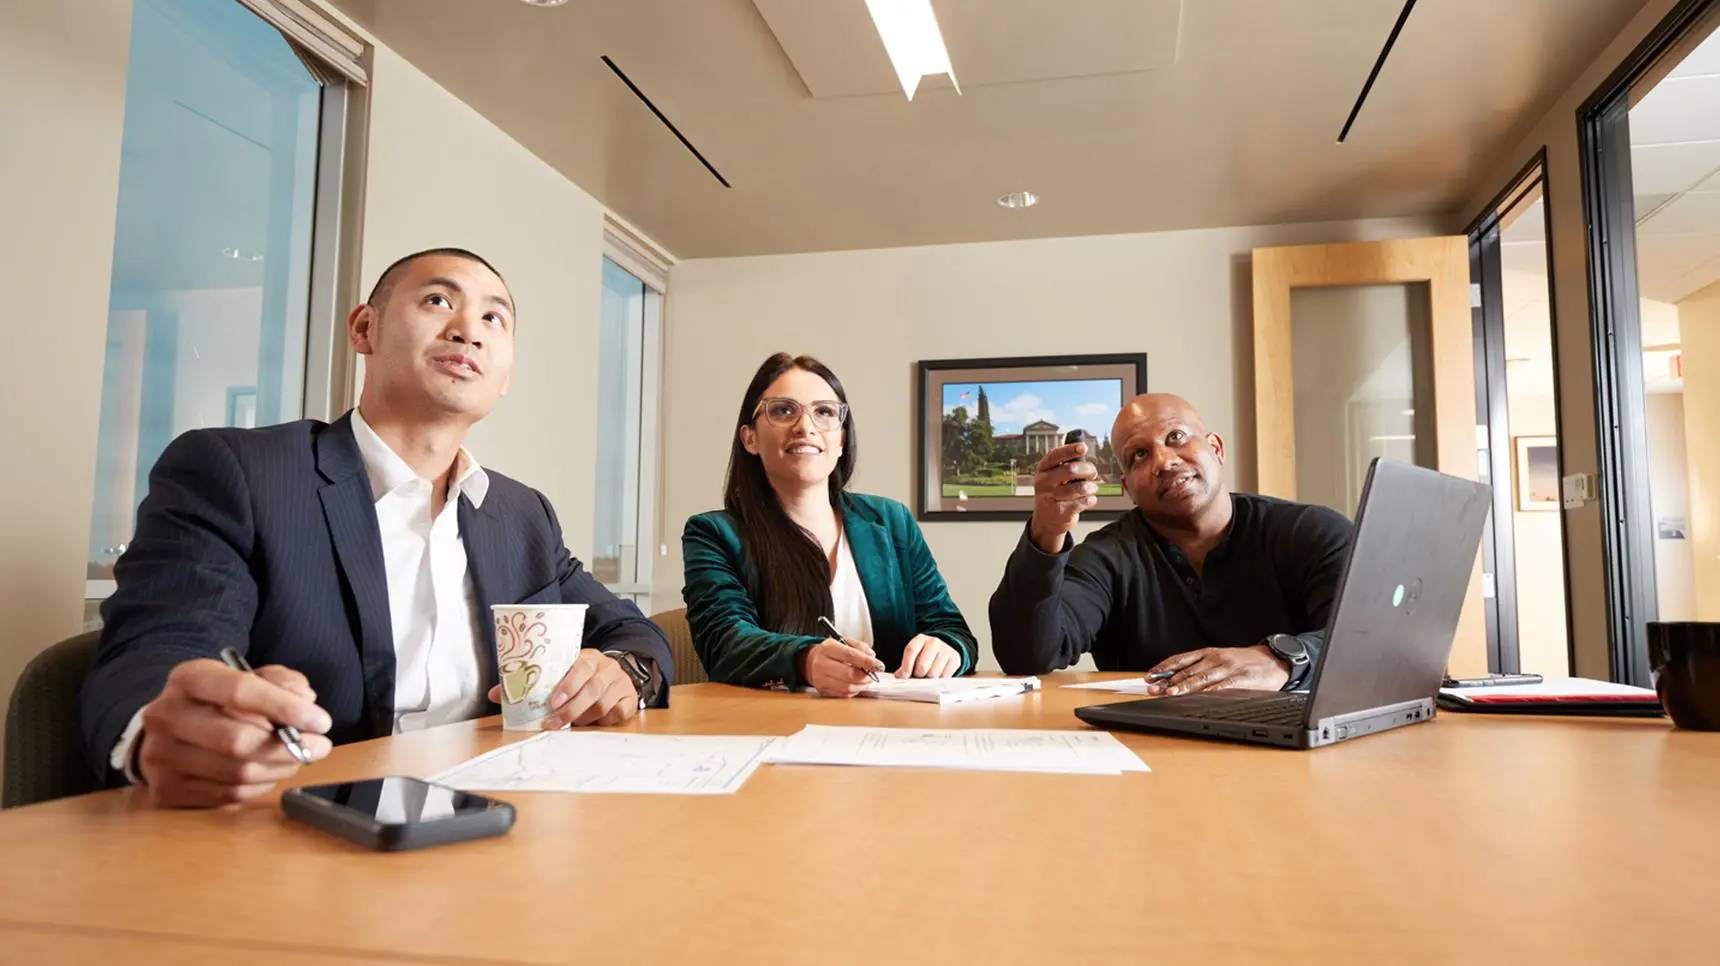
Why professionals should advance their education
Why professionals should advance their education

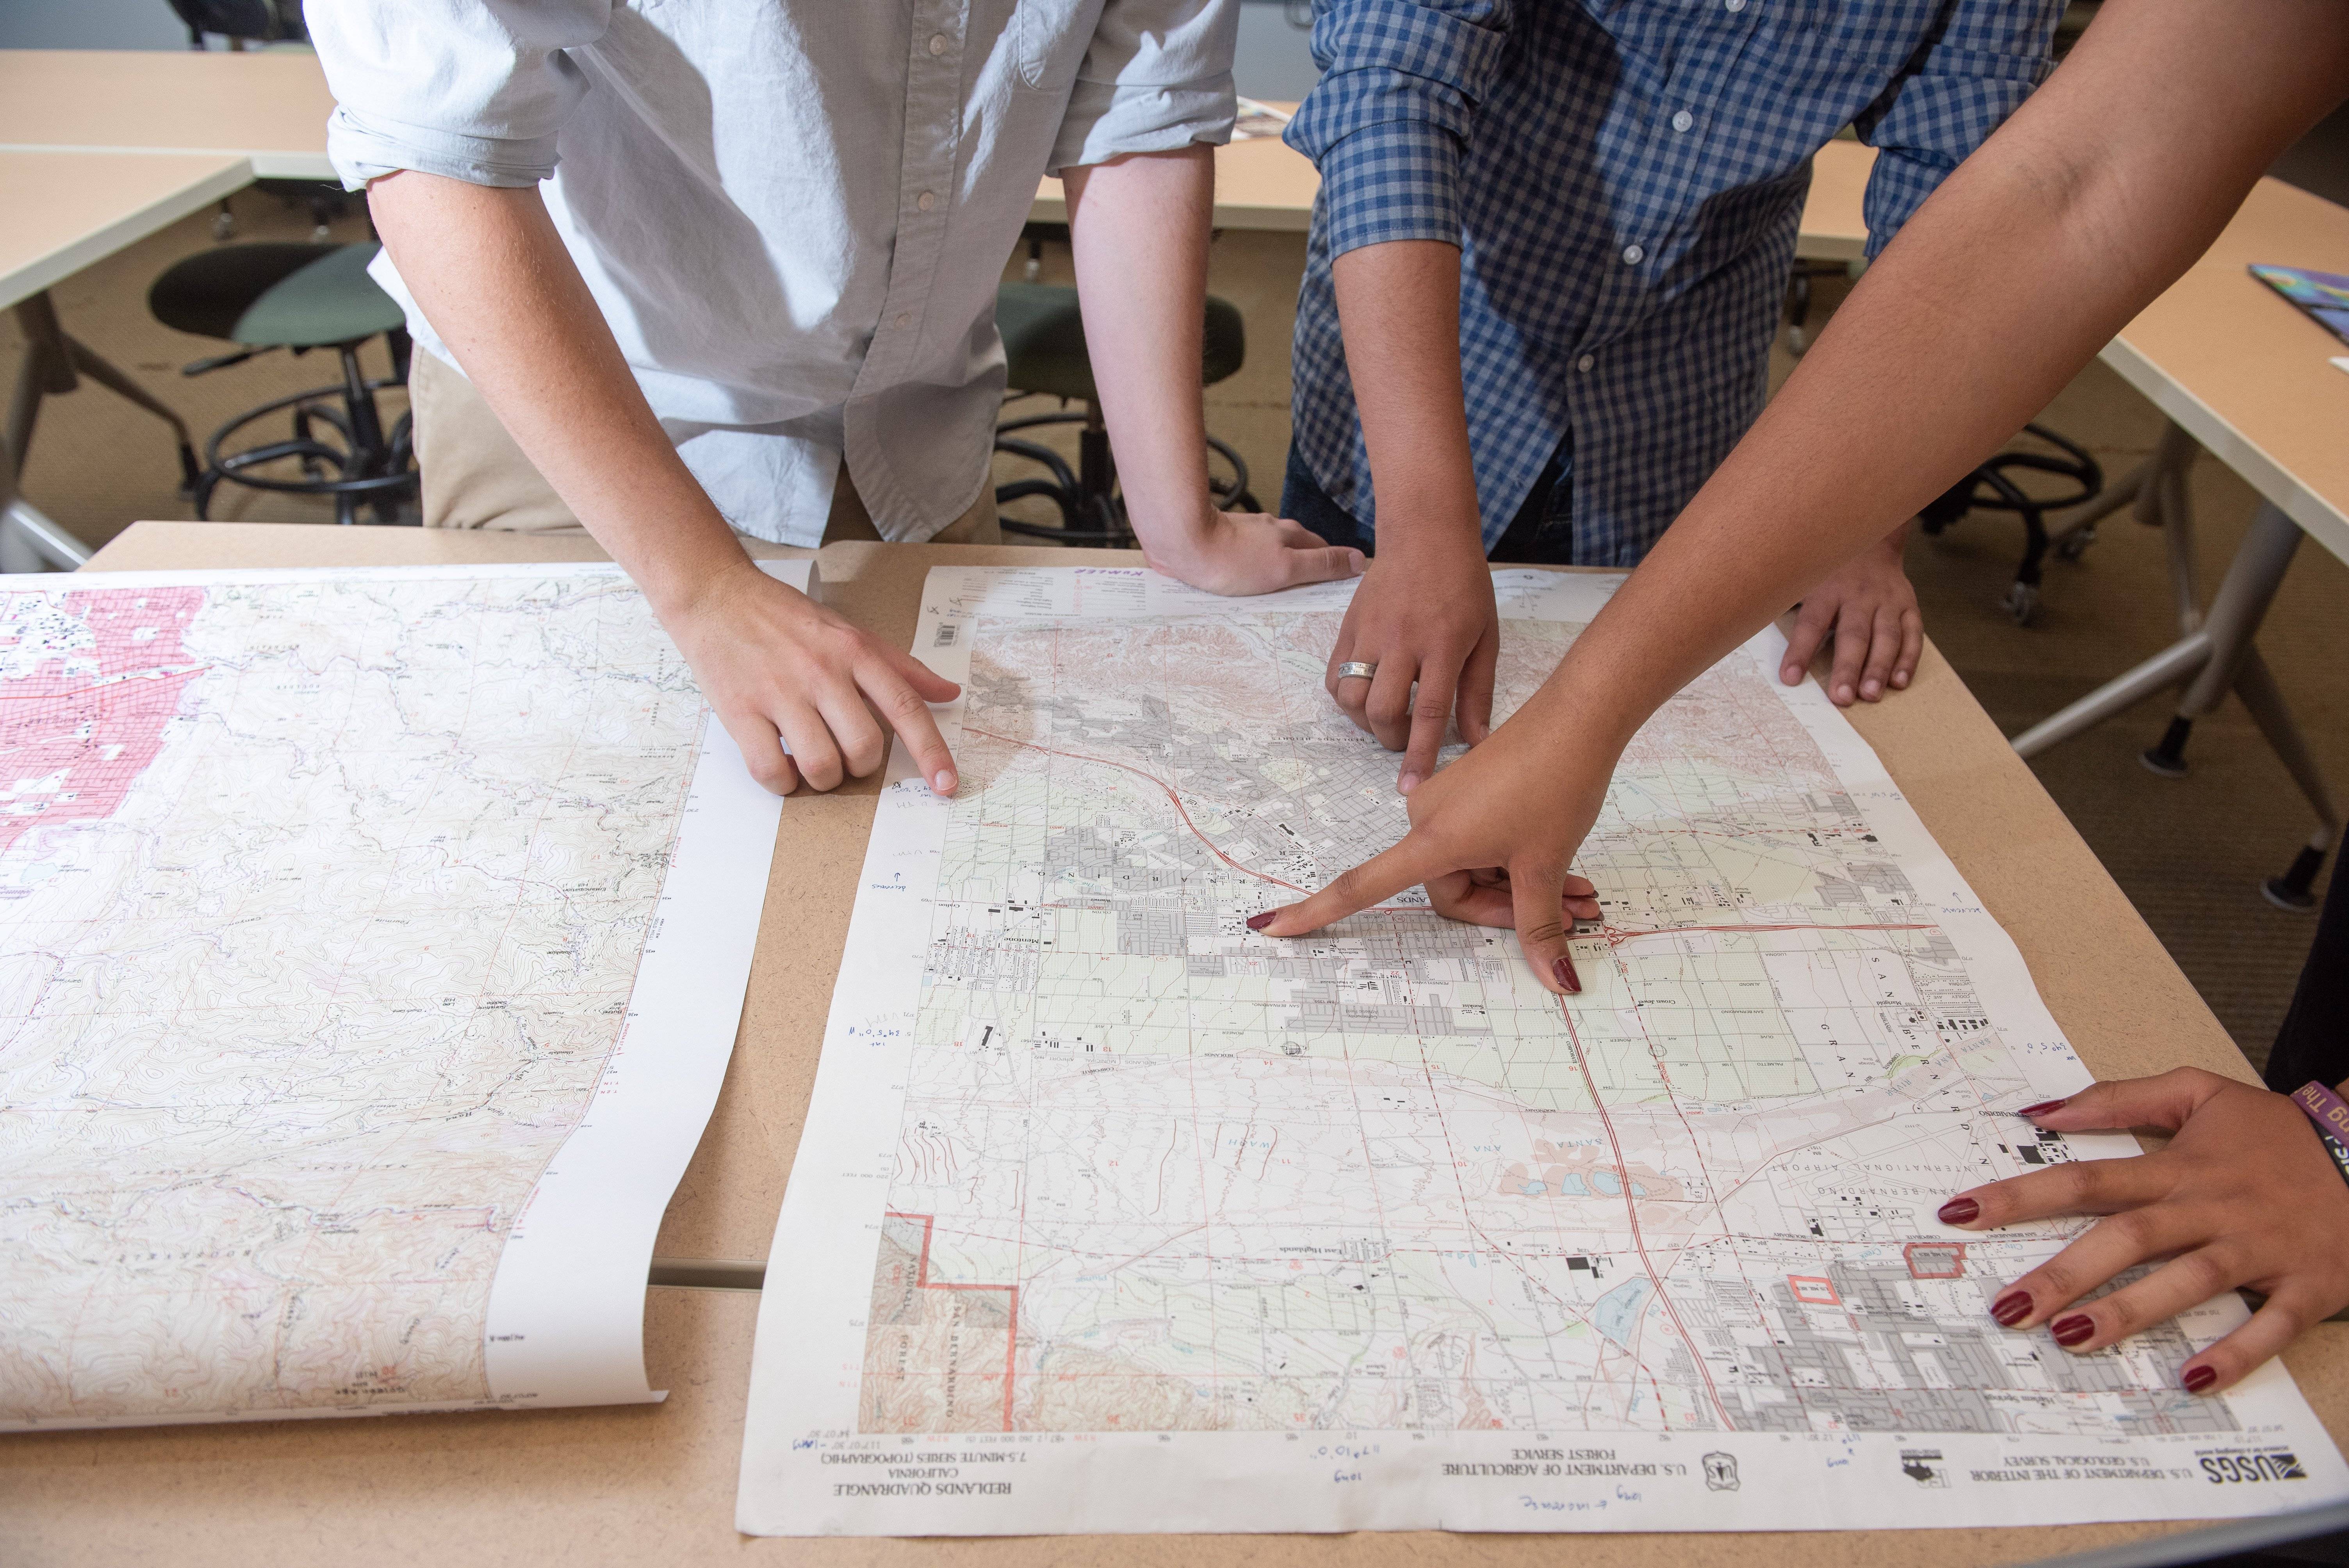
Why study GIS at Redlands

Why study GIS at Redlands
Where are Redlands graduates now


Partnership with Esri
Esri’s close proximity to University of Redlands and our shared focus on problem-solving have fostered partnerships in academics, research, employee development, and community programs:
- Esri employees teach, mentor, and supervise Redlands students who receive Summer internships at Esri.
- Esri's co-founders, Jack and Laura Dangermond, fund the Roger Tomlinson Prize for Excellence in GIS, awarded to Redlands students who provide GIS solutions to real-world problems.
- Esri offers scholarships and a GIS master’s fellowship for employees studying at Redlands, and our School of Business & Society provides tuition discounts specifically for Esri employees.
- The Redlands Forum, sponsored by Esri and University of Redlands Town & Gown, offers educational and cultural programs to the community.
Global and Local Partnerships
University of Redlands is forging strong partnerships with universities, school districts, and agencies – globally and locally.
A recent milestone is the creation of a new Executive Master of GIS program, designed in partnership with Esri, and delivered to senior executives of a geospatial regulatory agency. Specialized courses were also designed and delivered at the Redlands campus to visiting cohorts comprised of data analysts, survey engineers, database developers and programmers, system analysts, GIS analysts, cartographers, and geophysicists.
Locally, we are designing articulated courses for high school students in the Inland Empire to explore GIS and its intersections with data science and AI for applied community learning and fostering college and career readiness as well as skills development.
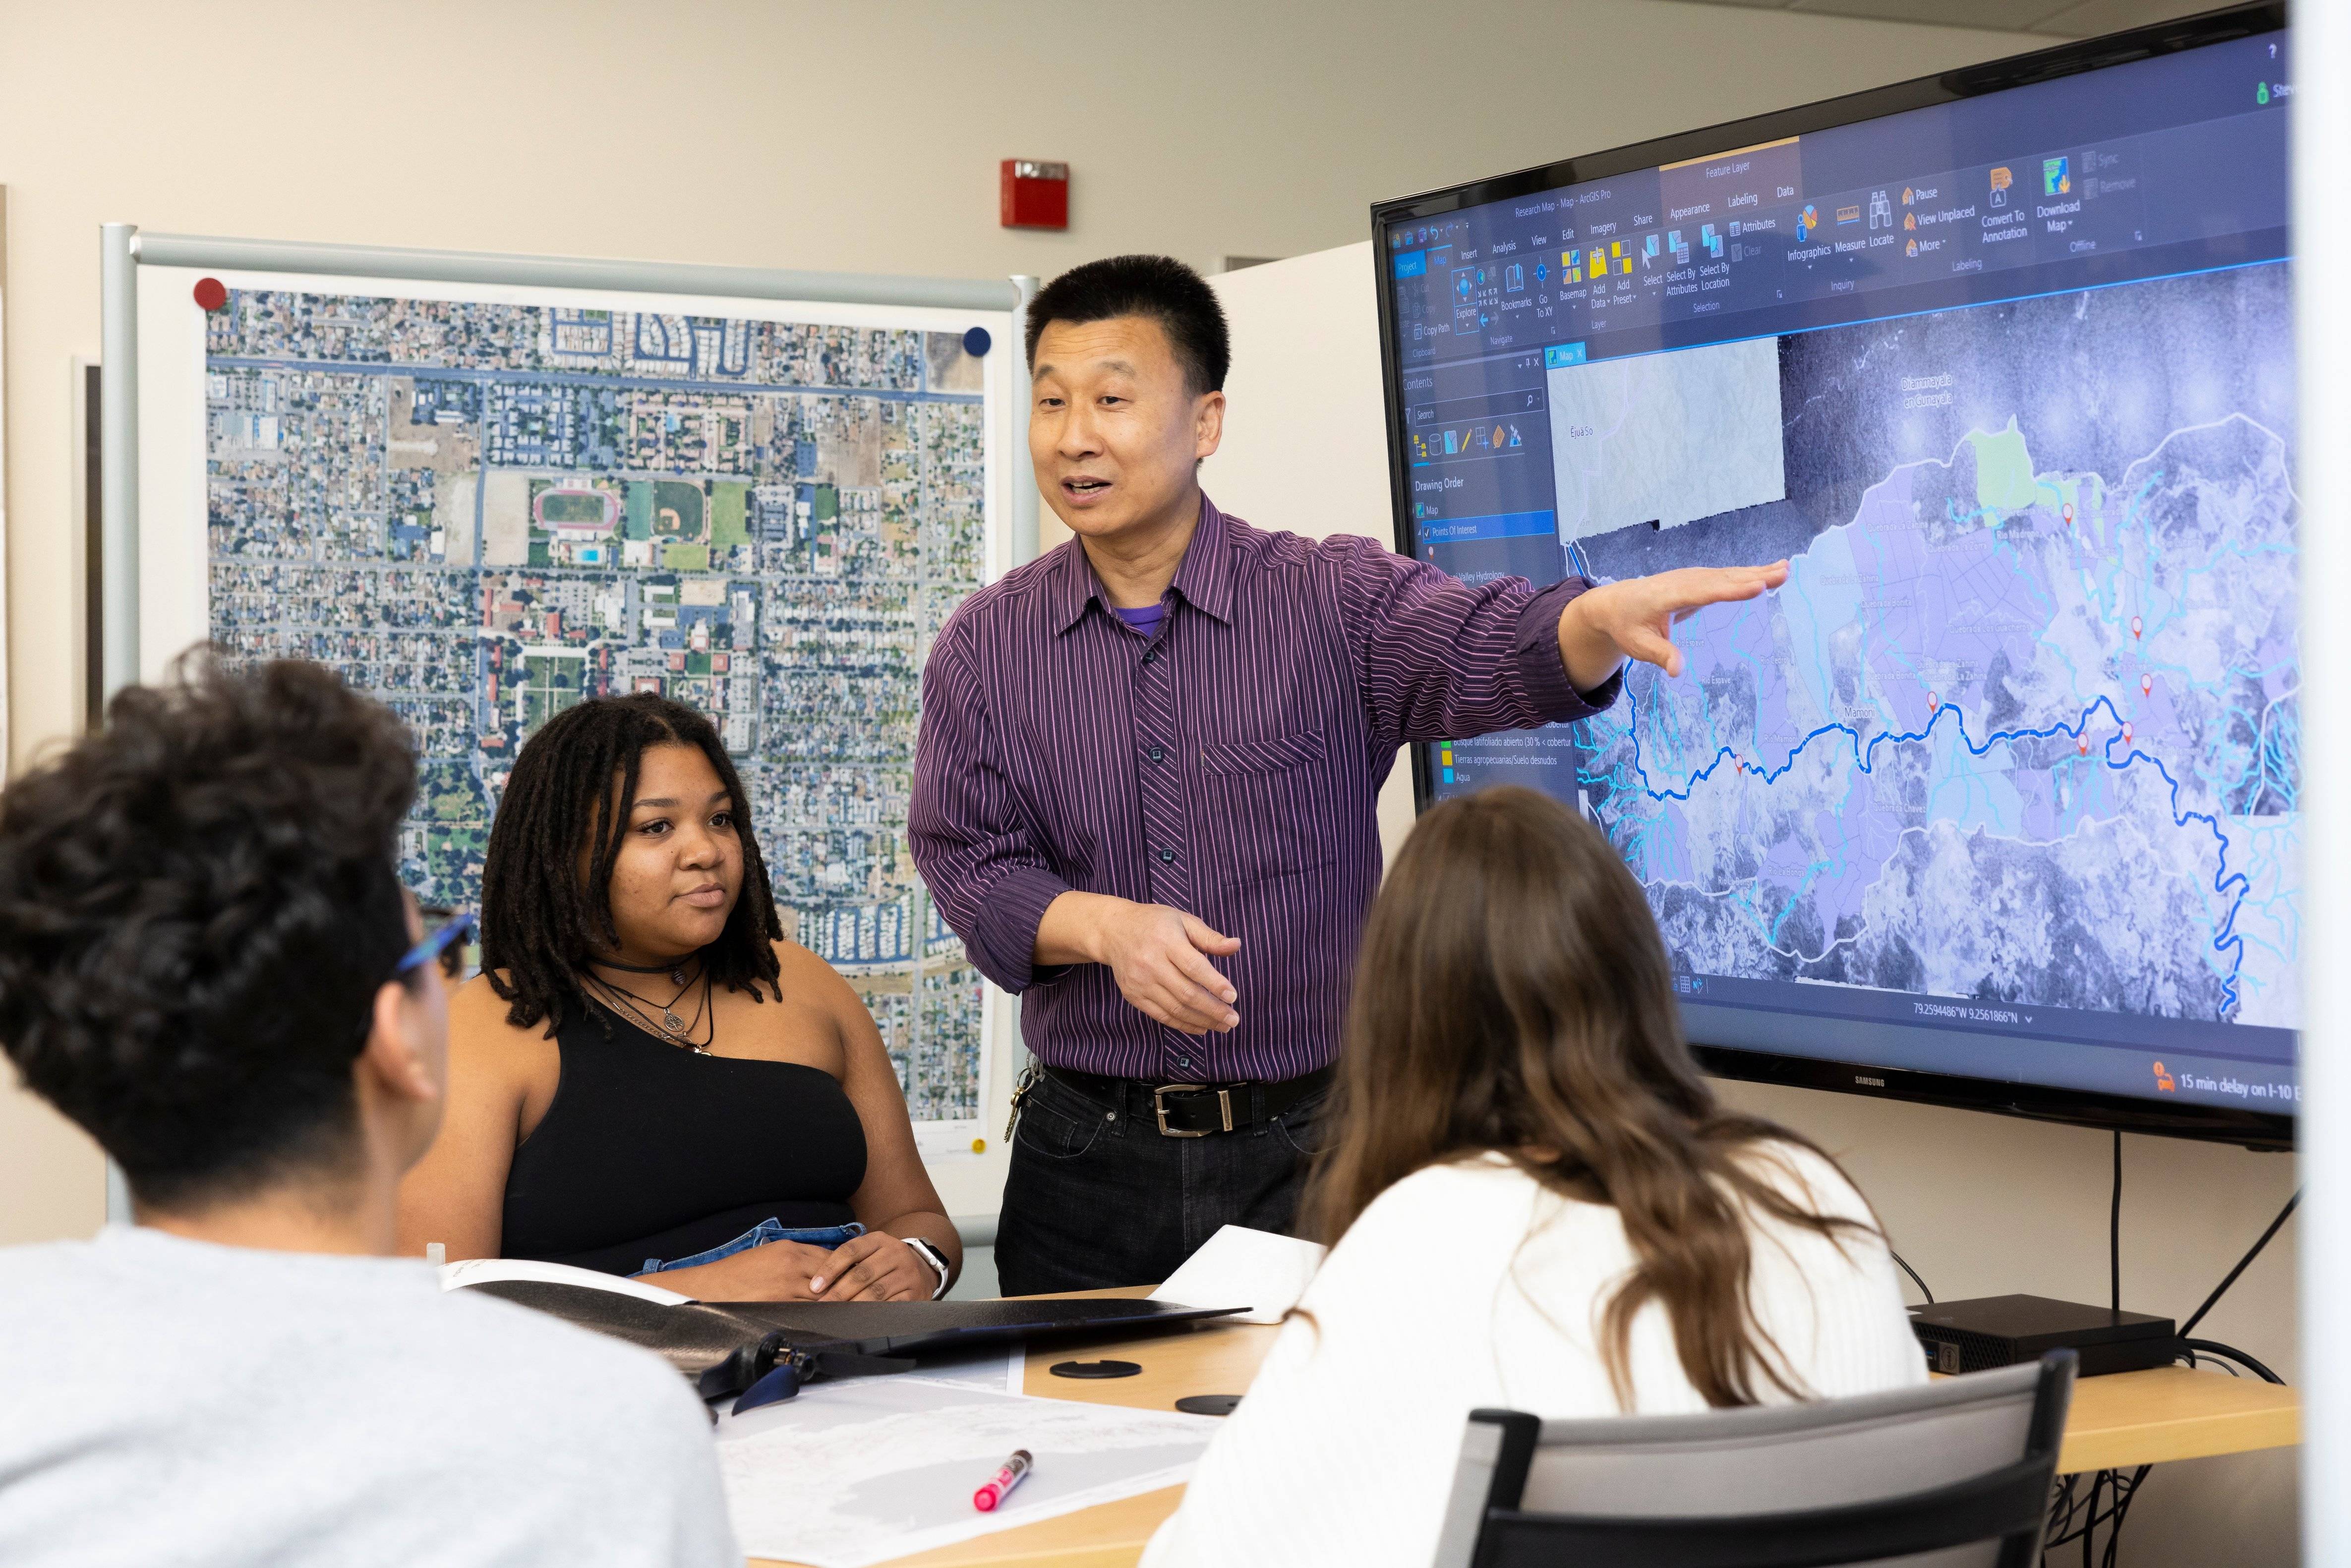
GIS in action: Transforming lives, communities, and the world
Redlands faculty and students are making their mark in the GIS industry, leading projects, driving innovation, and contributing to real-world solutions. Explore the latest news and highlights showcasing their impact.
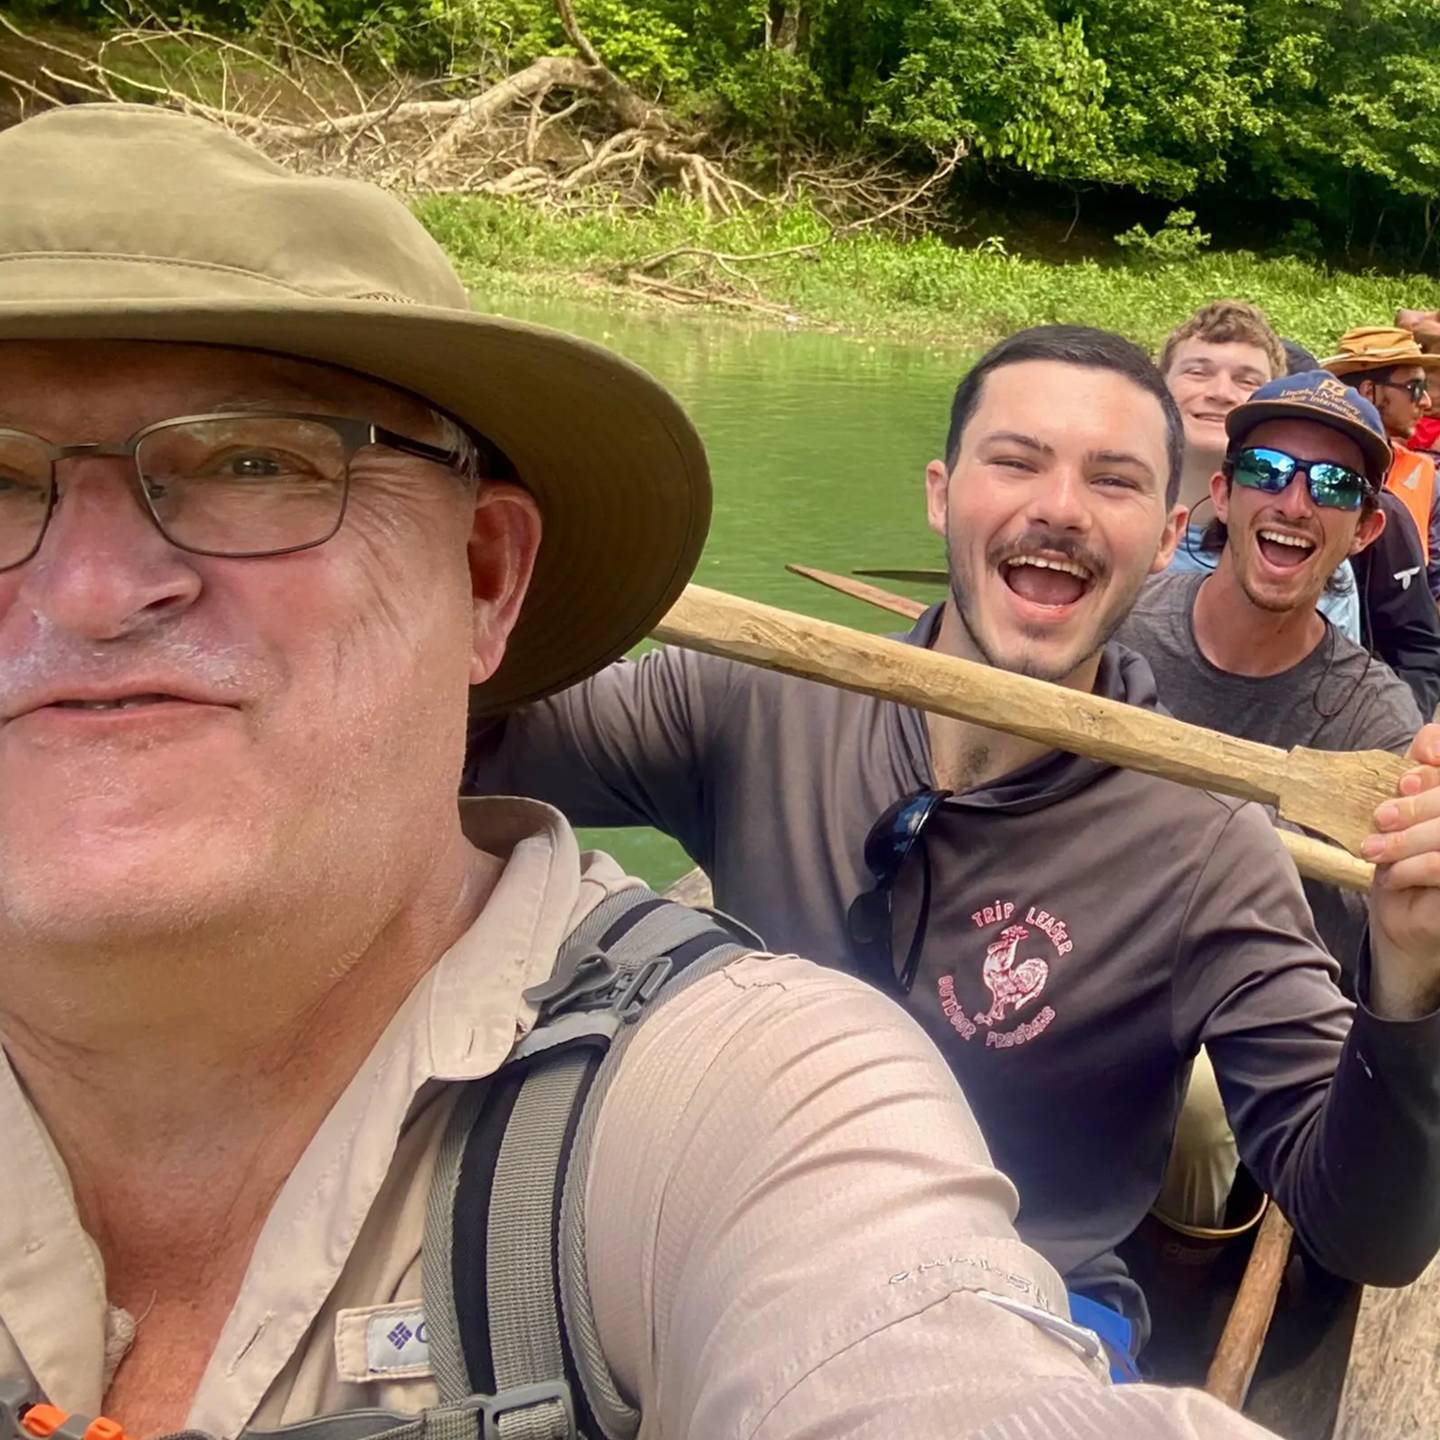
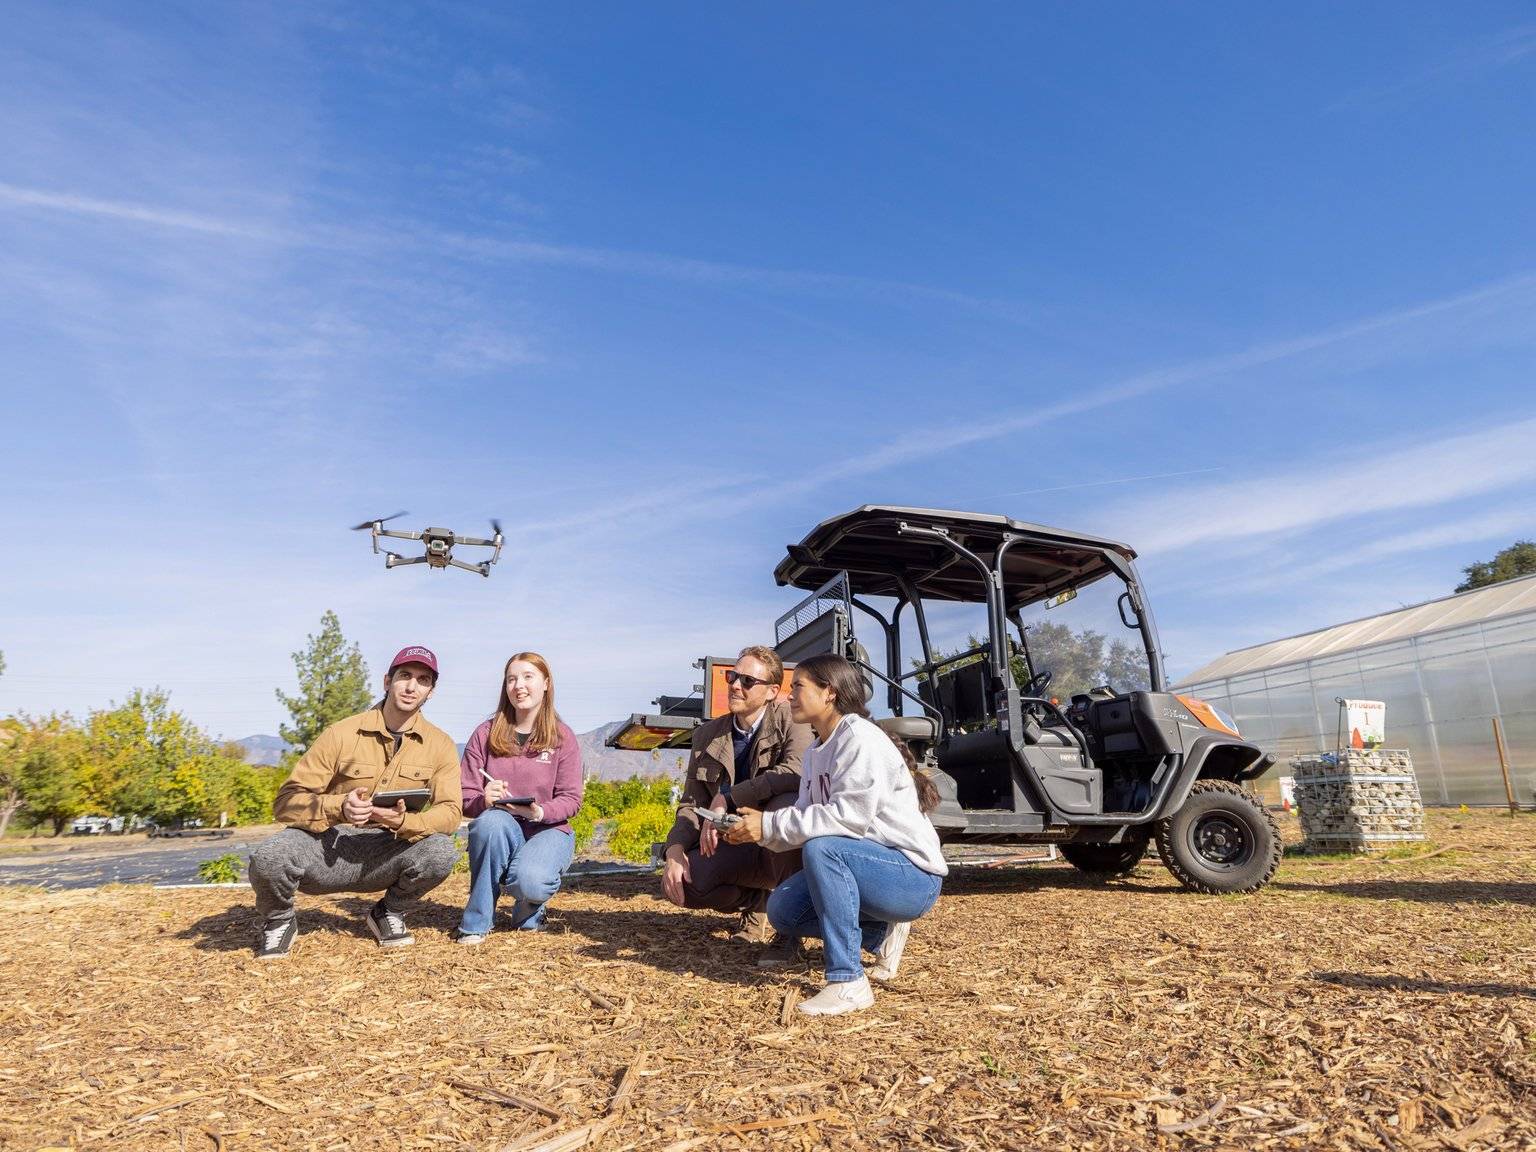
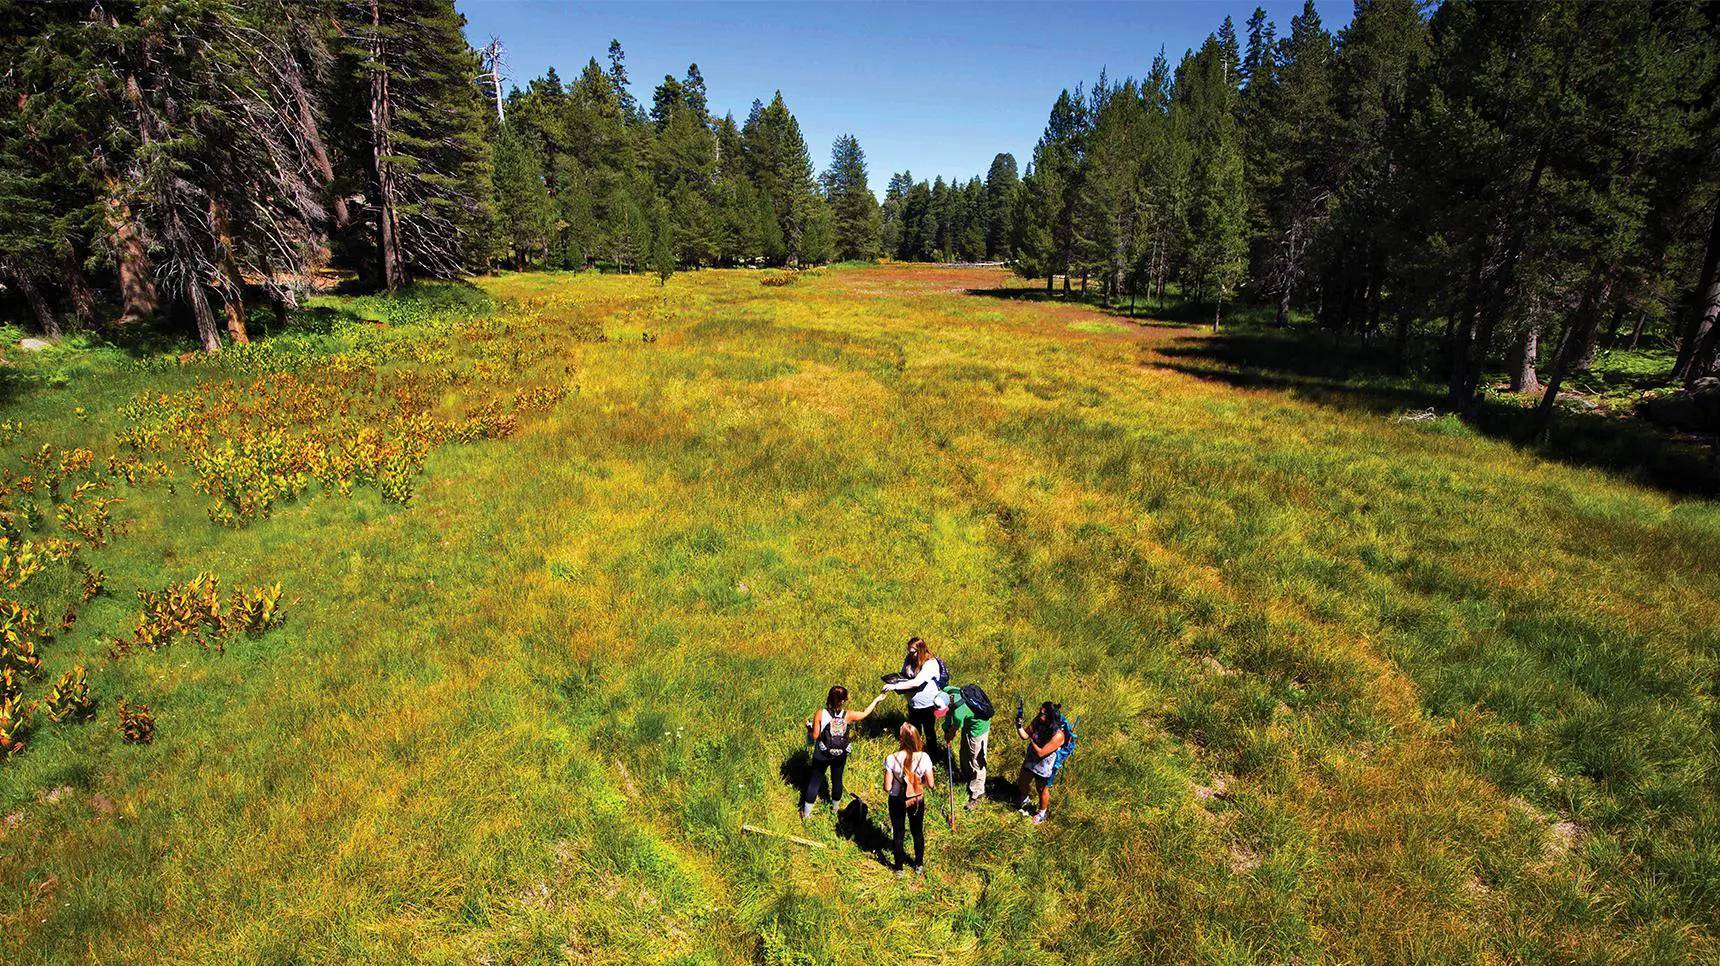
PanaMapping in Panama
Panama is a popular May Term Travel course open to all CAS students. Through Professor Dan Klooster’s PanaMapping program, students Ian and Keegan share their experiential learning in the Panamanian rainforest, using GIS to map deforestation, monitor forest regrowth, and fly drones.

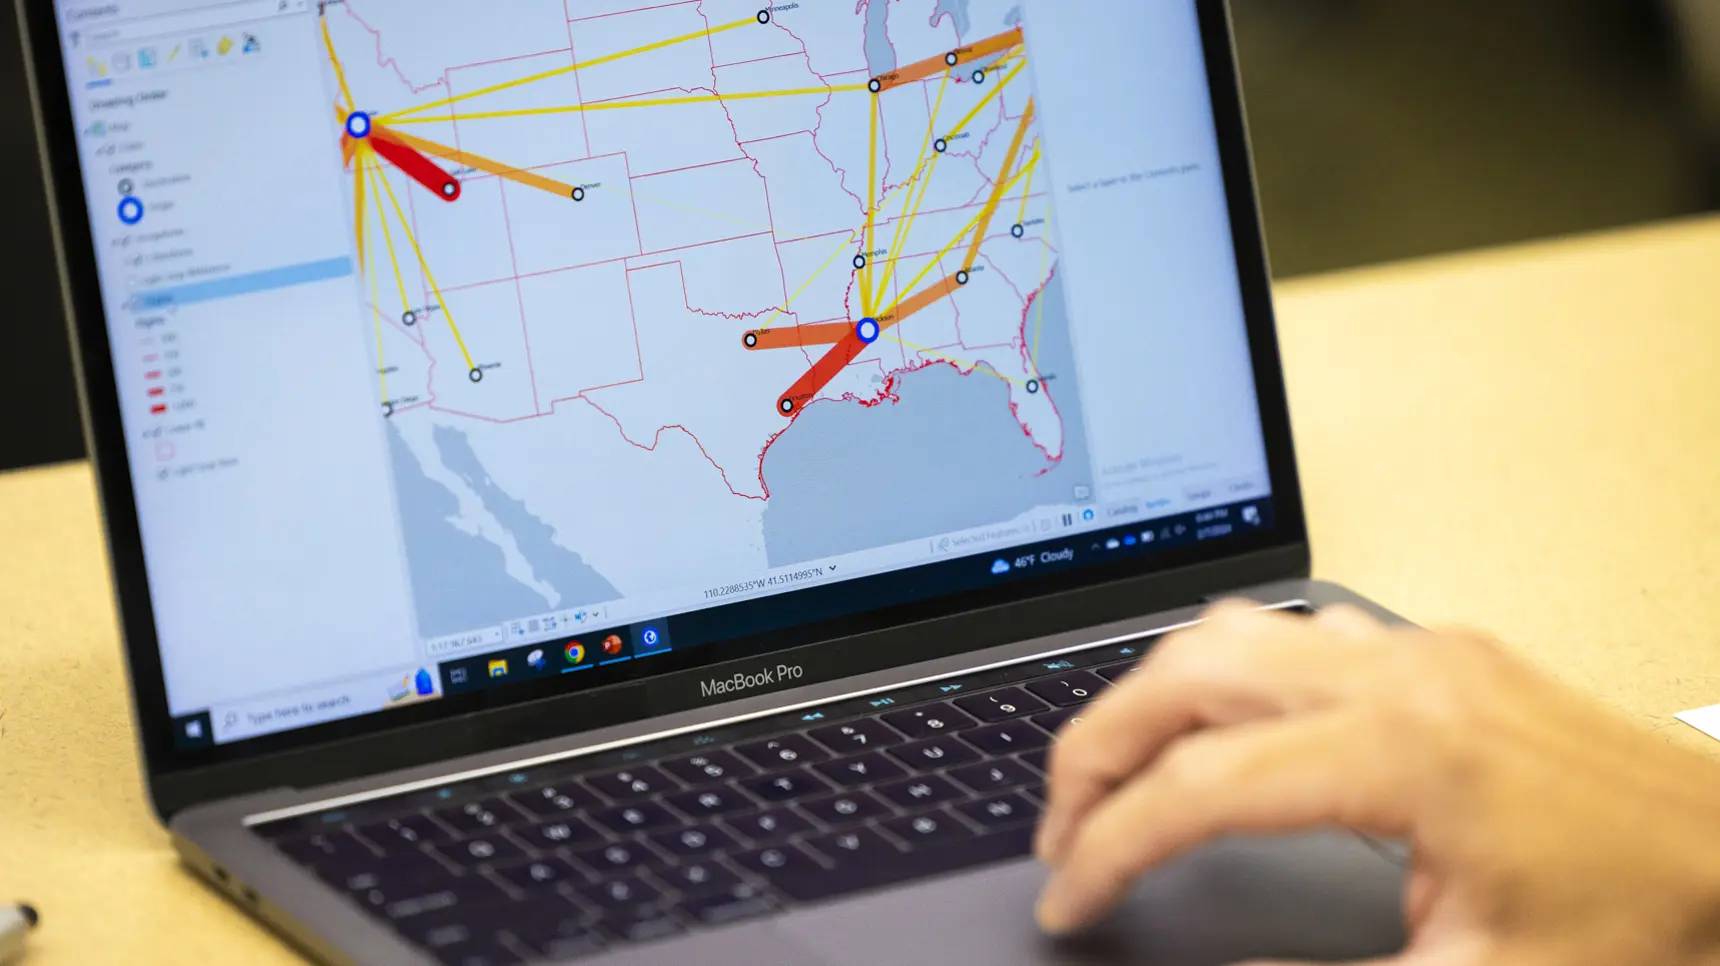
Lisa Berry '13 shares her passion for GIS and racing
As Senior GIS Engineer and ArcGIS Living Atlas Evangelist at Esri, Berry ’13 helps users turn data into action. Off the clock, she races with Berry Family Racing, where GIS drives real-time strategy for her father, husband, sisters, and brother-in-law.
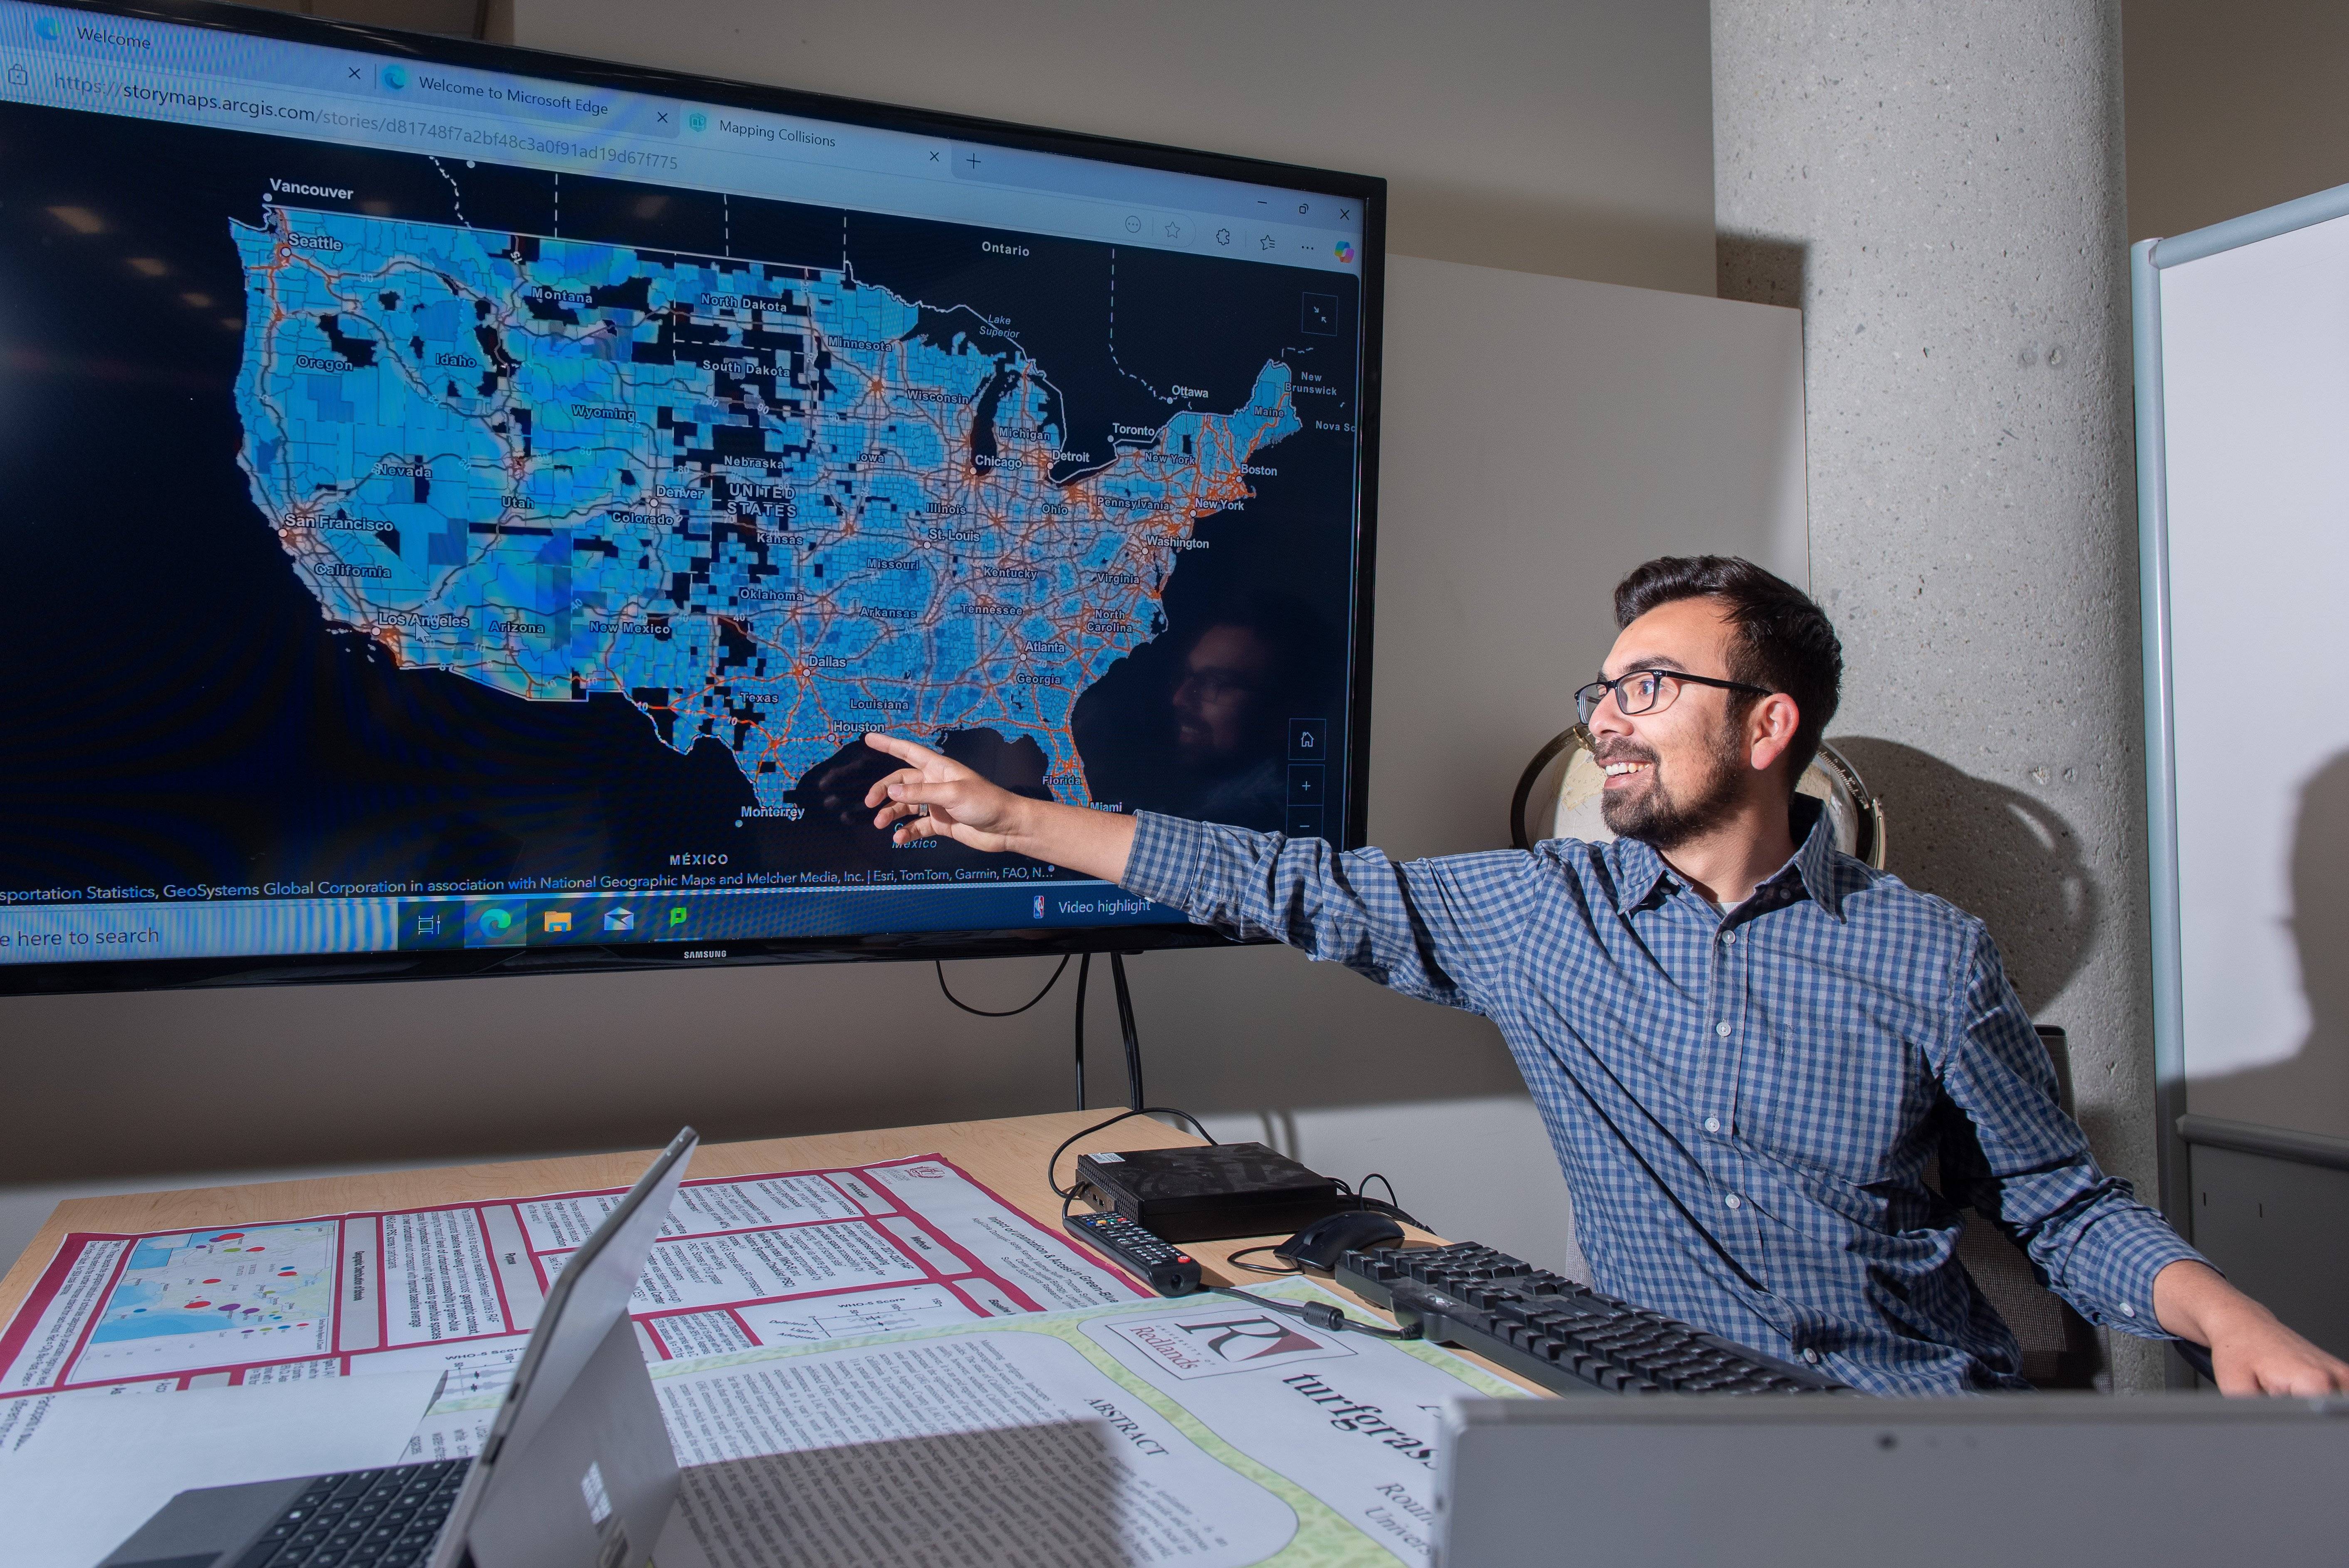
Owen Giron '23 advances global research in AI and GIS
Giron ’23 turned his graduate experience into global research on AI readiness and the digital divide across 137 countries. Balancing work, study, and mentorship, his journey shows the power of perseverance, faculty support, and data-driven impact.

Liz Parrish '17 combines GIS and business for success
In the ever-evolving landscape of Geographic Information Systems (GIS), Liz Parrish '17, an MBA alumna of U of R's School of Business & Society, stands out as an example of the power of education and dedication.
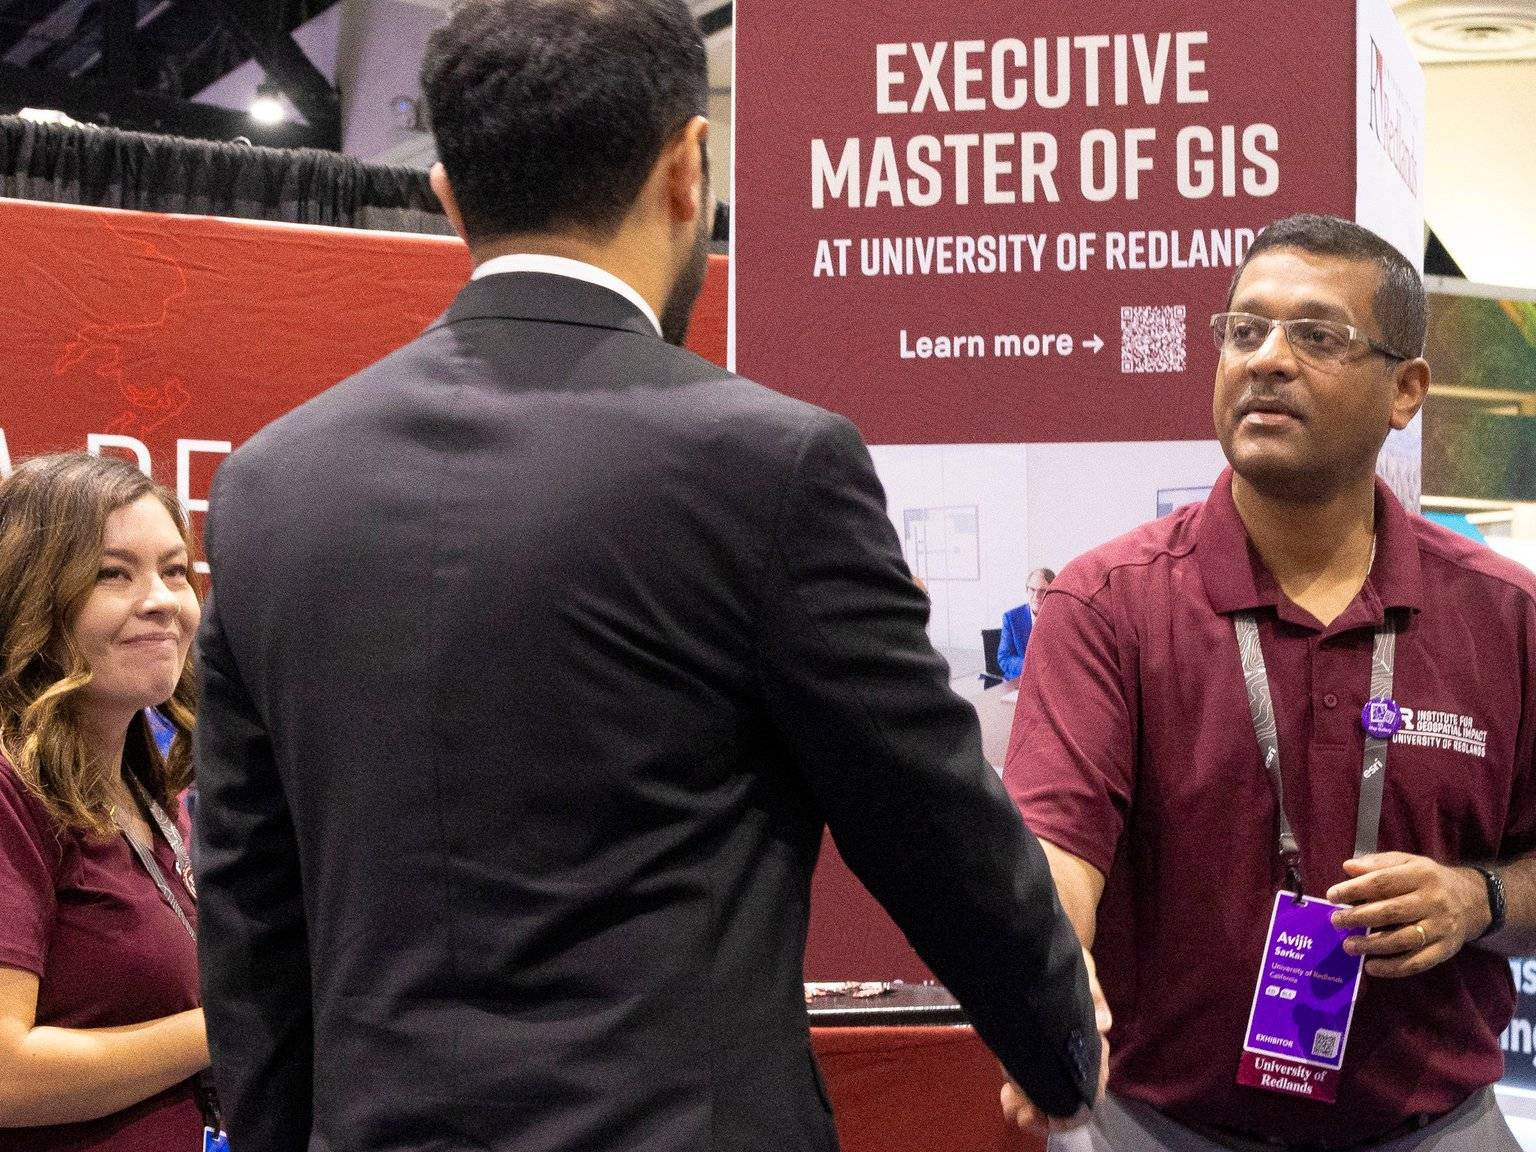
Redlands strives to lead in advancing geospatial programs
Led by School of Business Society Professor Avijit Sarkar, IGI addresses urgent challenges from climate change to social justice by preparing the next generation of geospatially skilled students, scholars, and professionals.

Lisa Berry ’13 shares her journey from Redlands to a career at Esri
Lisa Berry ’13 returned to Redlands to share how the university launched her GIS career and lasting connection with Esri. Now a senior GIS engineer, she continues to inspire future geospatial leaders.

SBS Completer Program helps Brooklyn Hodge ’26 earn her degree
Brooklyn Hodge ’26 shares her journey of returning to school after a 10-year break, juggling motherhood, a full-time job at Esri, and the pursuit of her business degree at the University of Redlands.
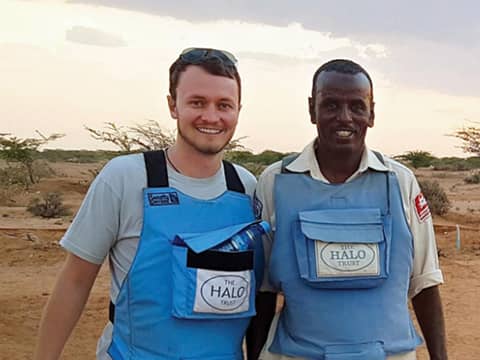
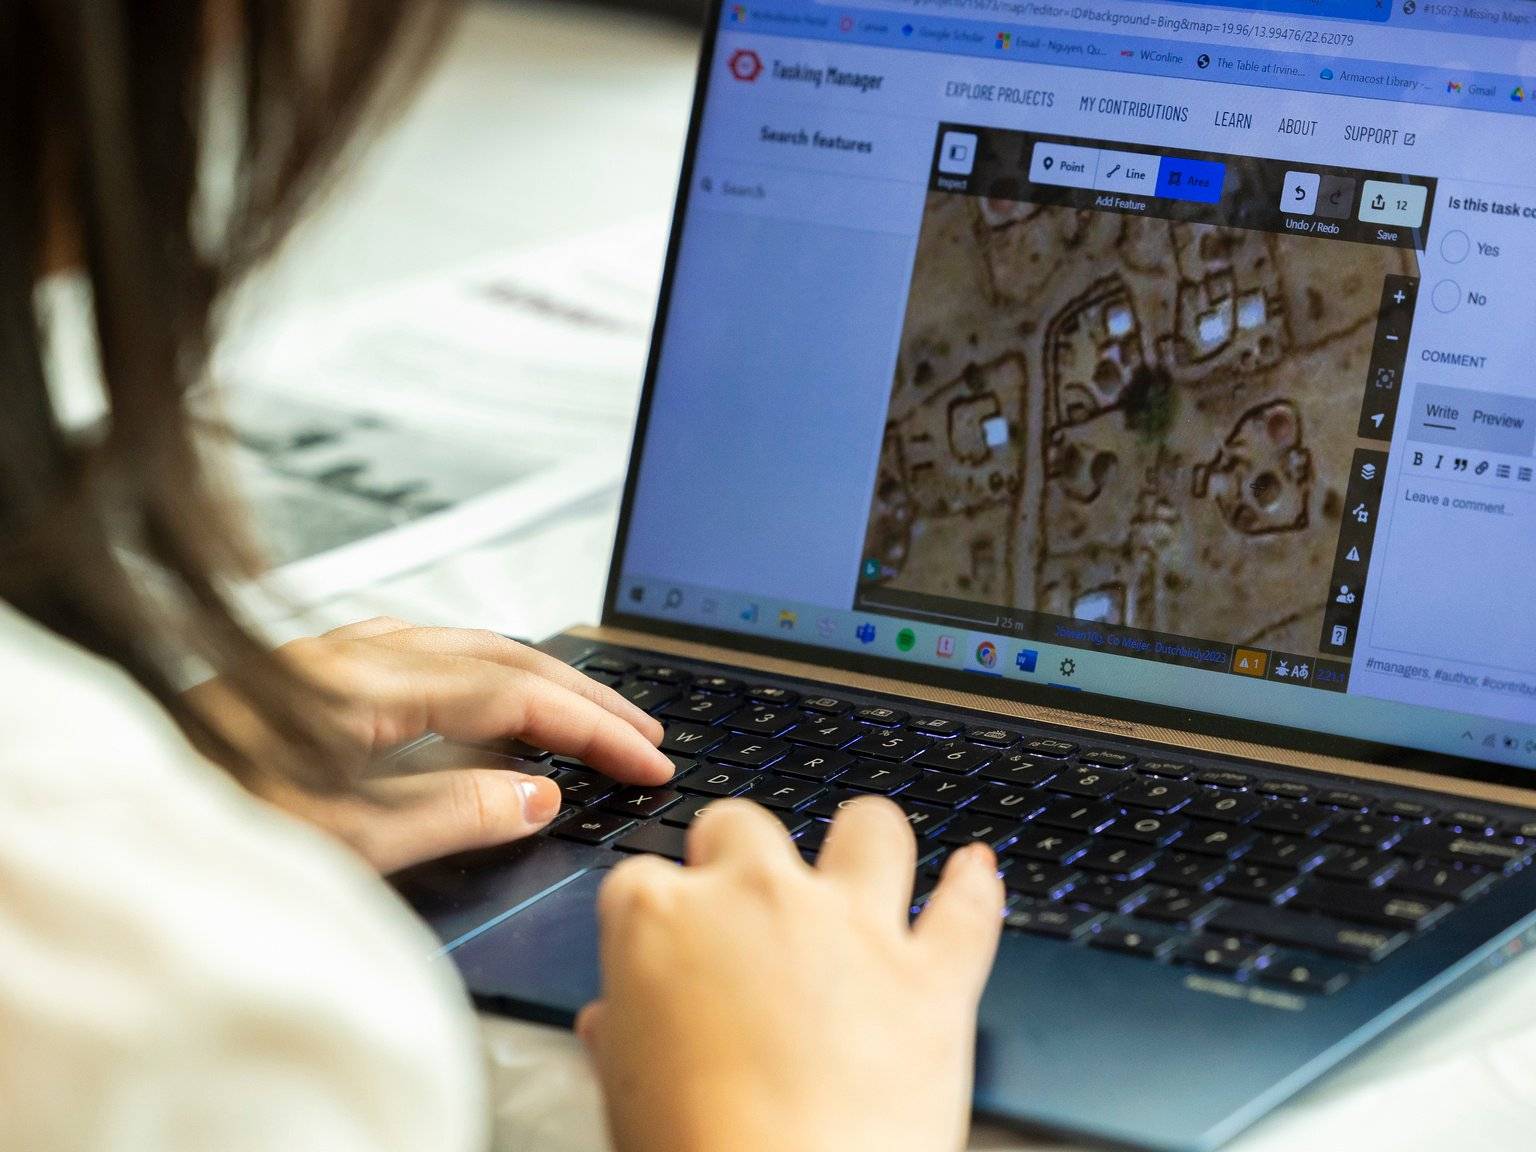
Jesse Hamlin ‘14 harnesses GIS to find and remove landmines
Hamlin ‘14 developed his expertise in GIS with an eye on making a real-world impact, and that journey, which began at University of Redlands, led him to a fulfilling role in humanitarian assistance.

Mapping metal across the globe with Dr. John Glover
Redlands' History Professor Dr. John Glover has undertaken the ambitious task of mapping metal to discover the connections between metal music and geography.
Featured videos
Faculty at University of Redlands share how they're using it to power everything from historical storytelling to mapping metal bands (edited by Eric Whedbee).
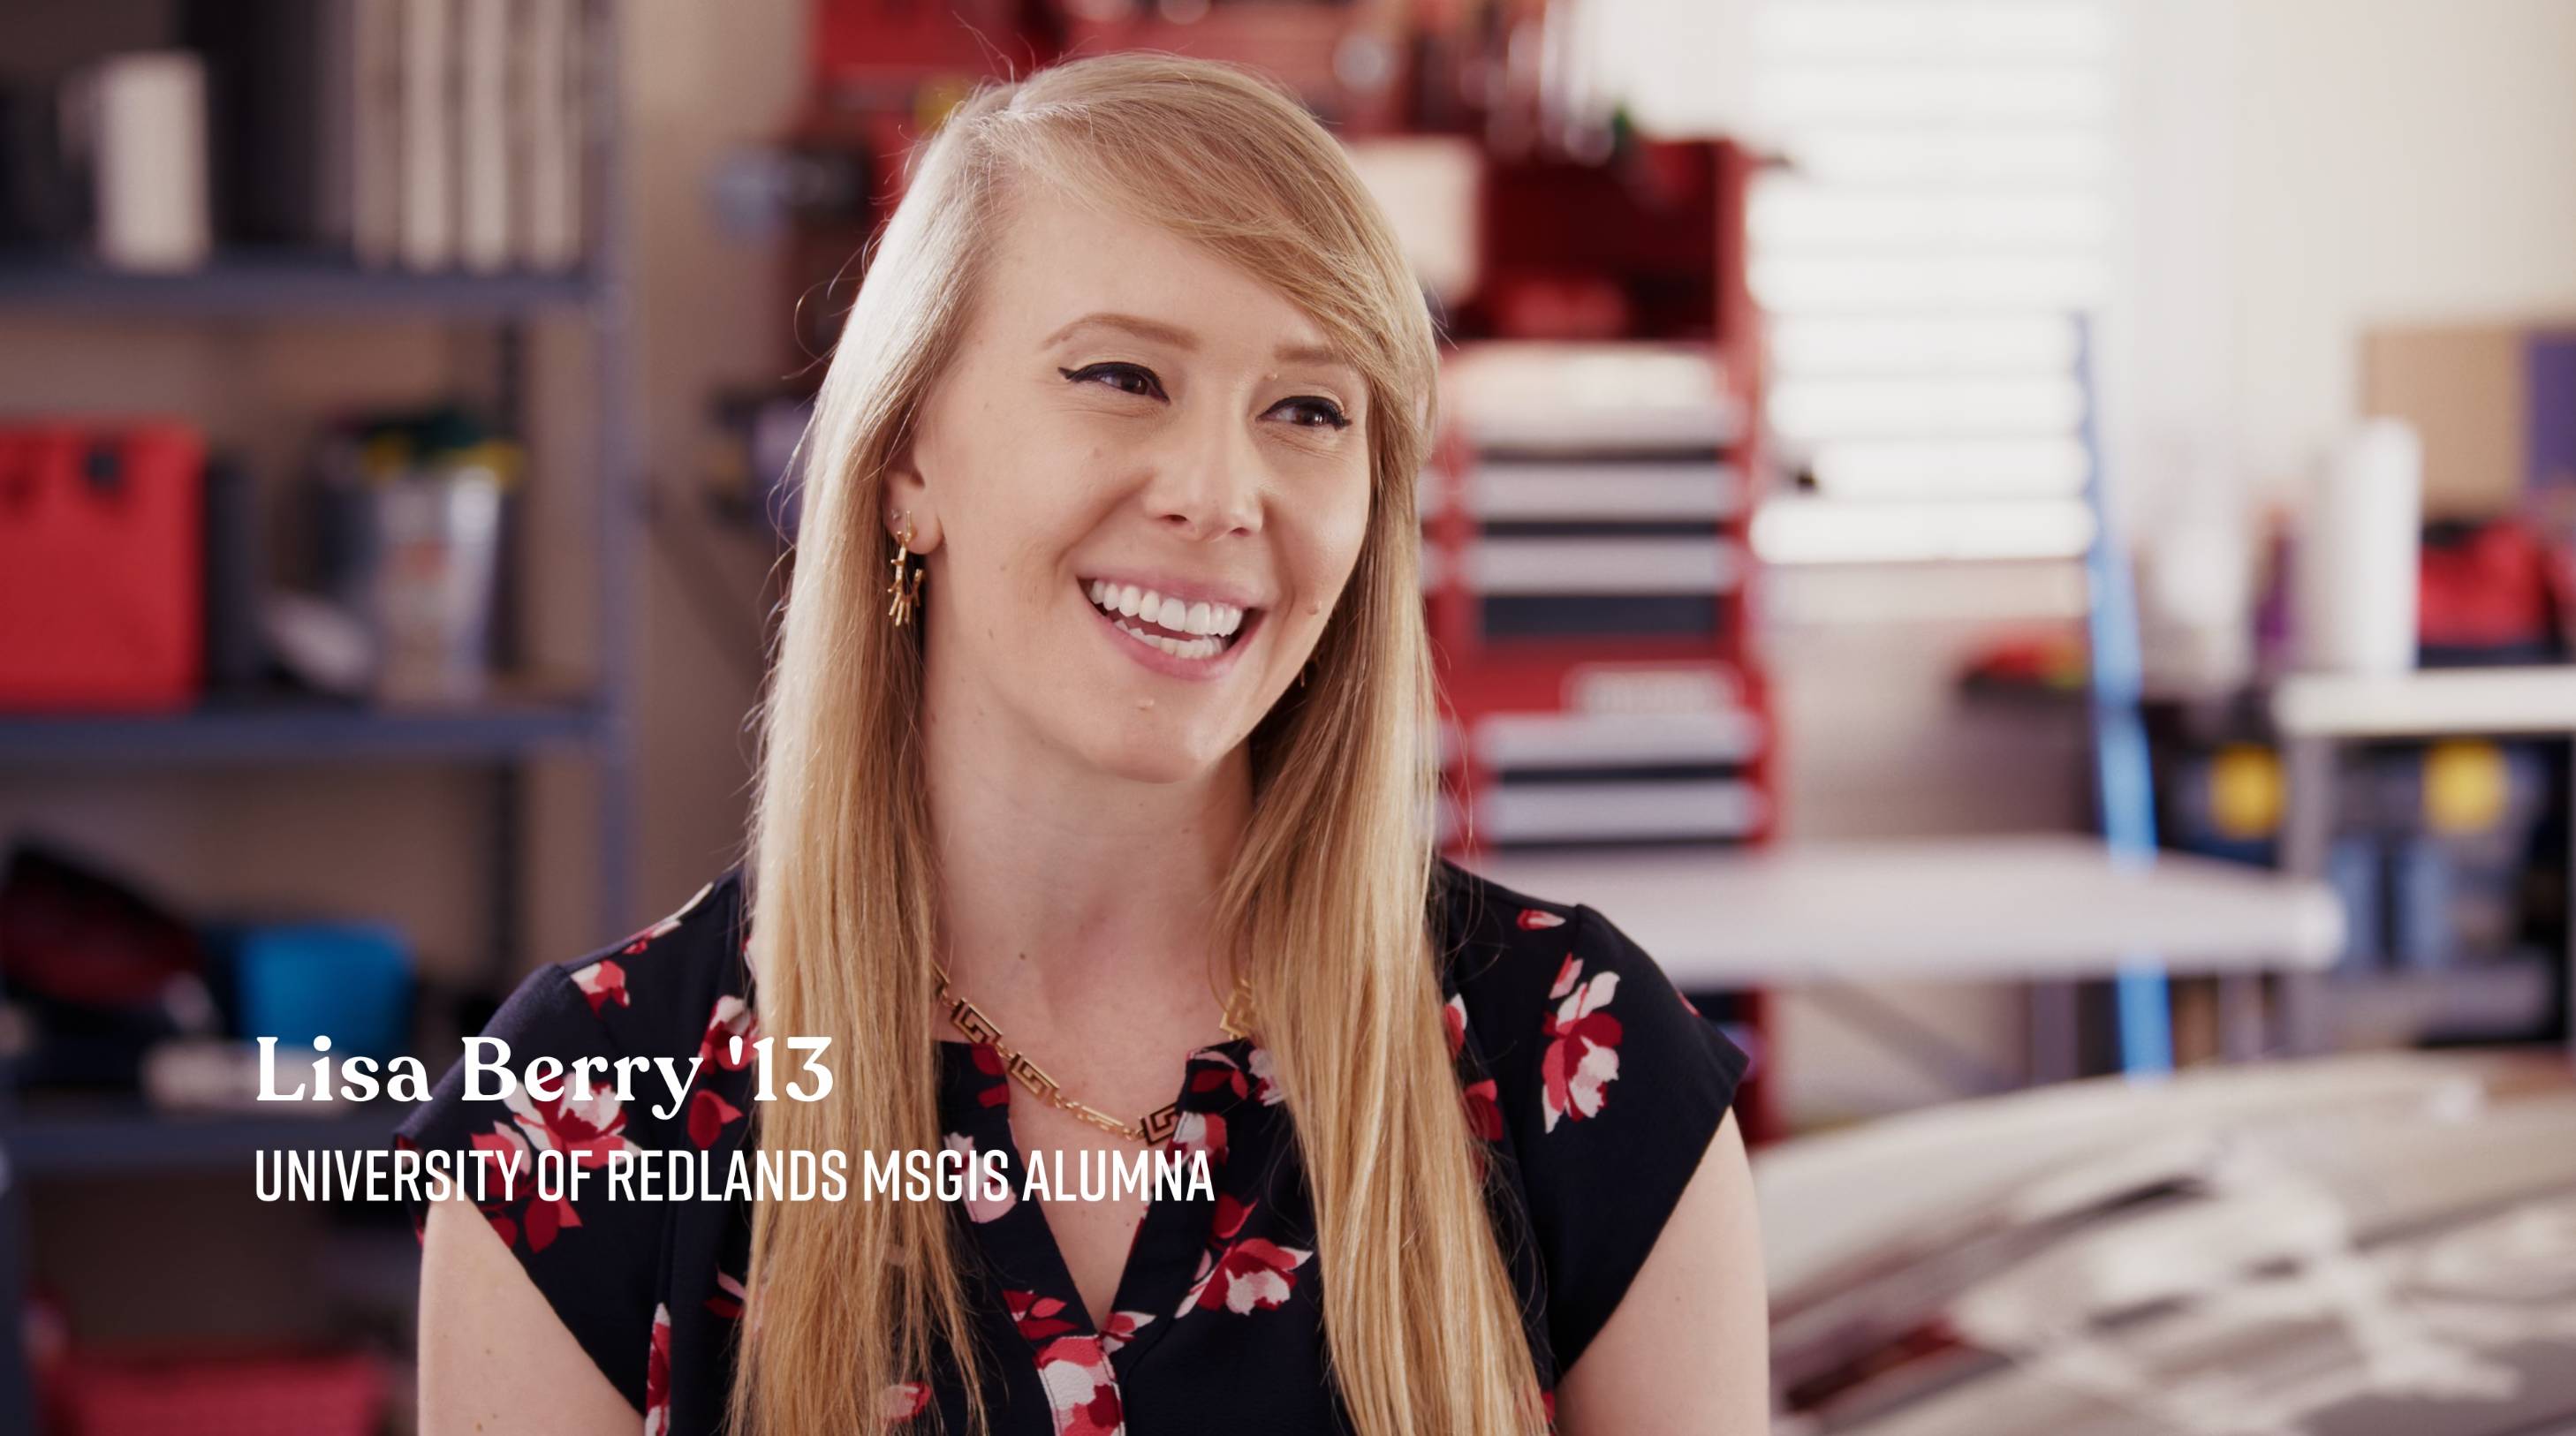
Lisa Berry '13, MSGIS Alumna, shares her love for racing, and how she learned to use maps in GIS to refine her racing style (edited by Eric Whedbee).

Student Testimonial
“I chose Redlands because I felt like it would give me the best education. I wanted to be challenged and really drive into the science of GIS, not just learn the software. I haven't been disappointed. The program has a great mix of full-time faculty, as well an amazing group of adjunct faculty who work at Esri during the day. With that mix we get the unique opportunity to learn the underlying science of GIS at a deep level, as well as to learn the latest technology trends from people who are developing GIS software on a daily basis.”
— Blythe Spendlove ’18, MS GIS
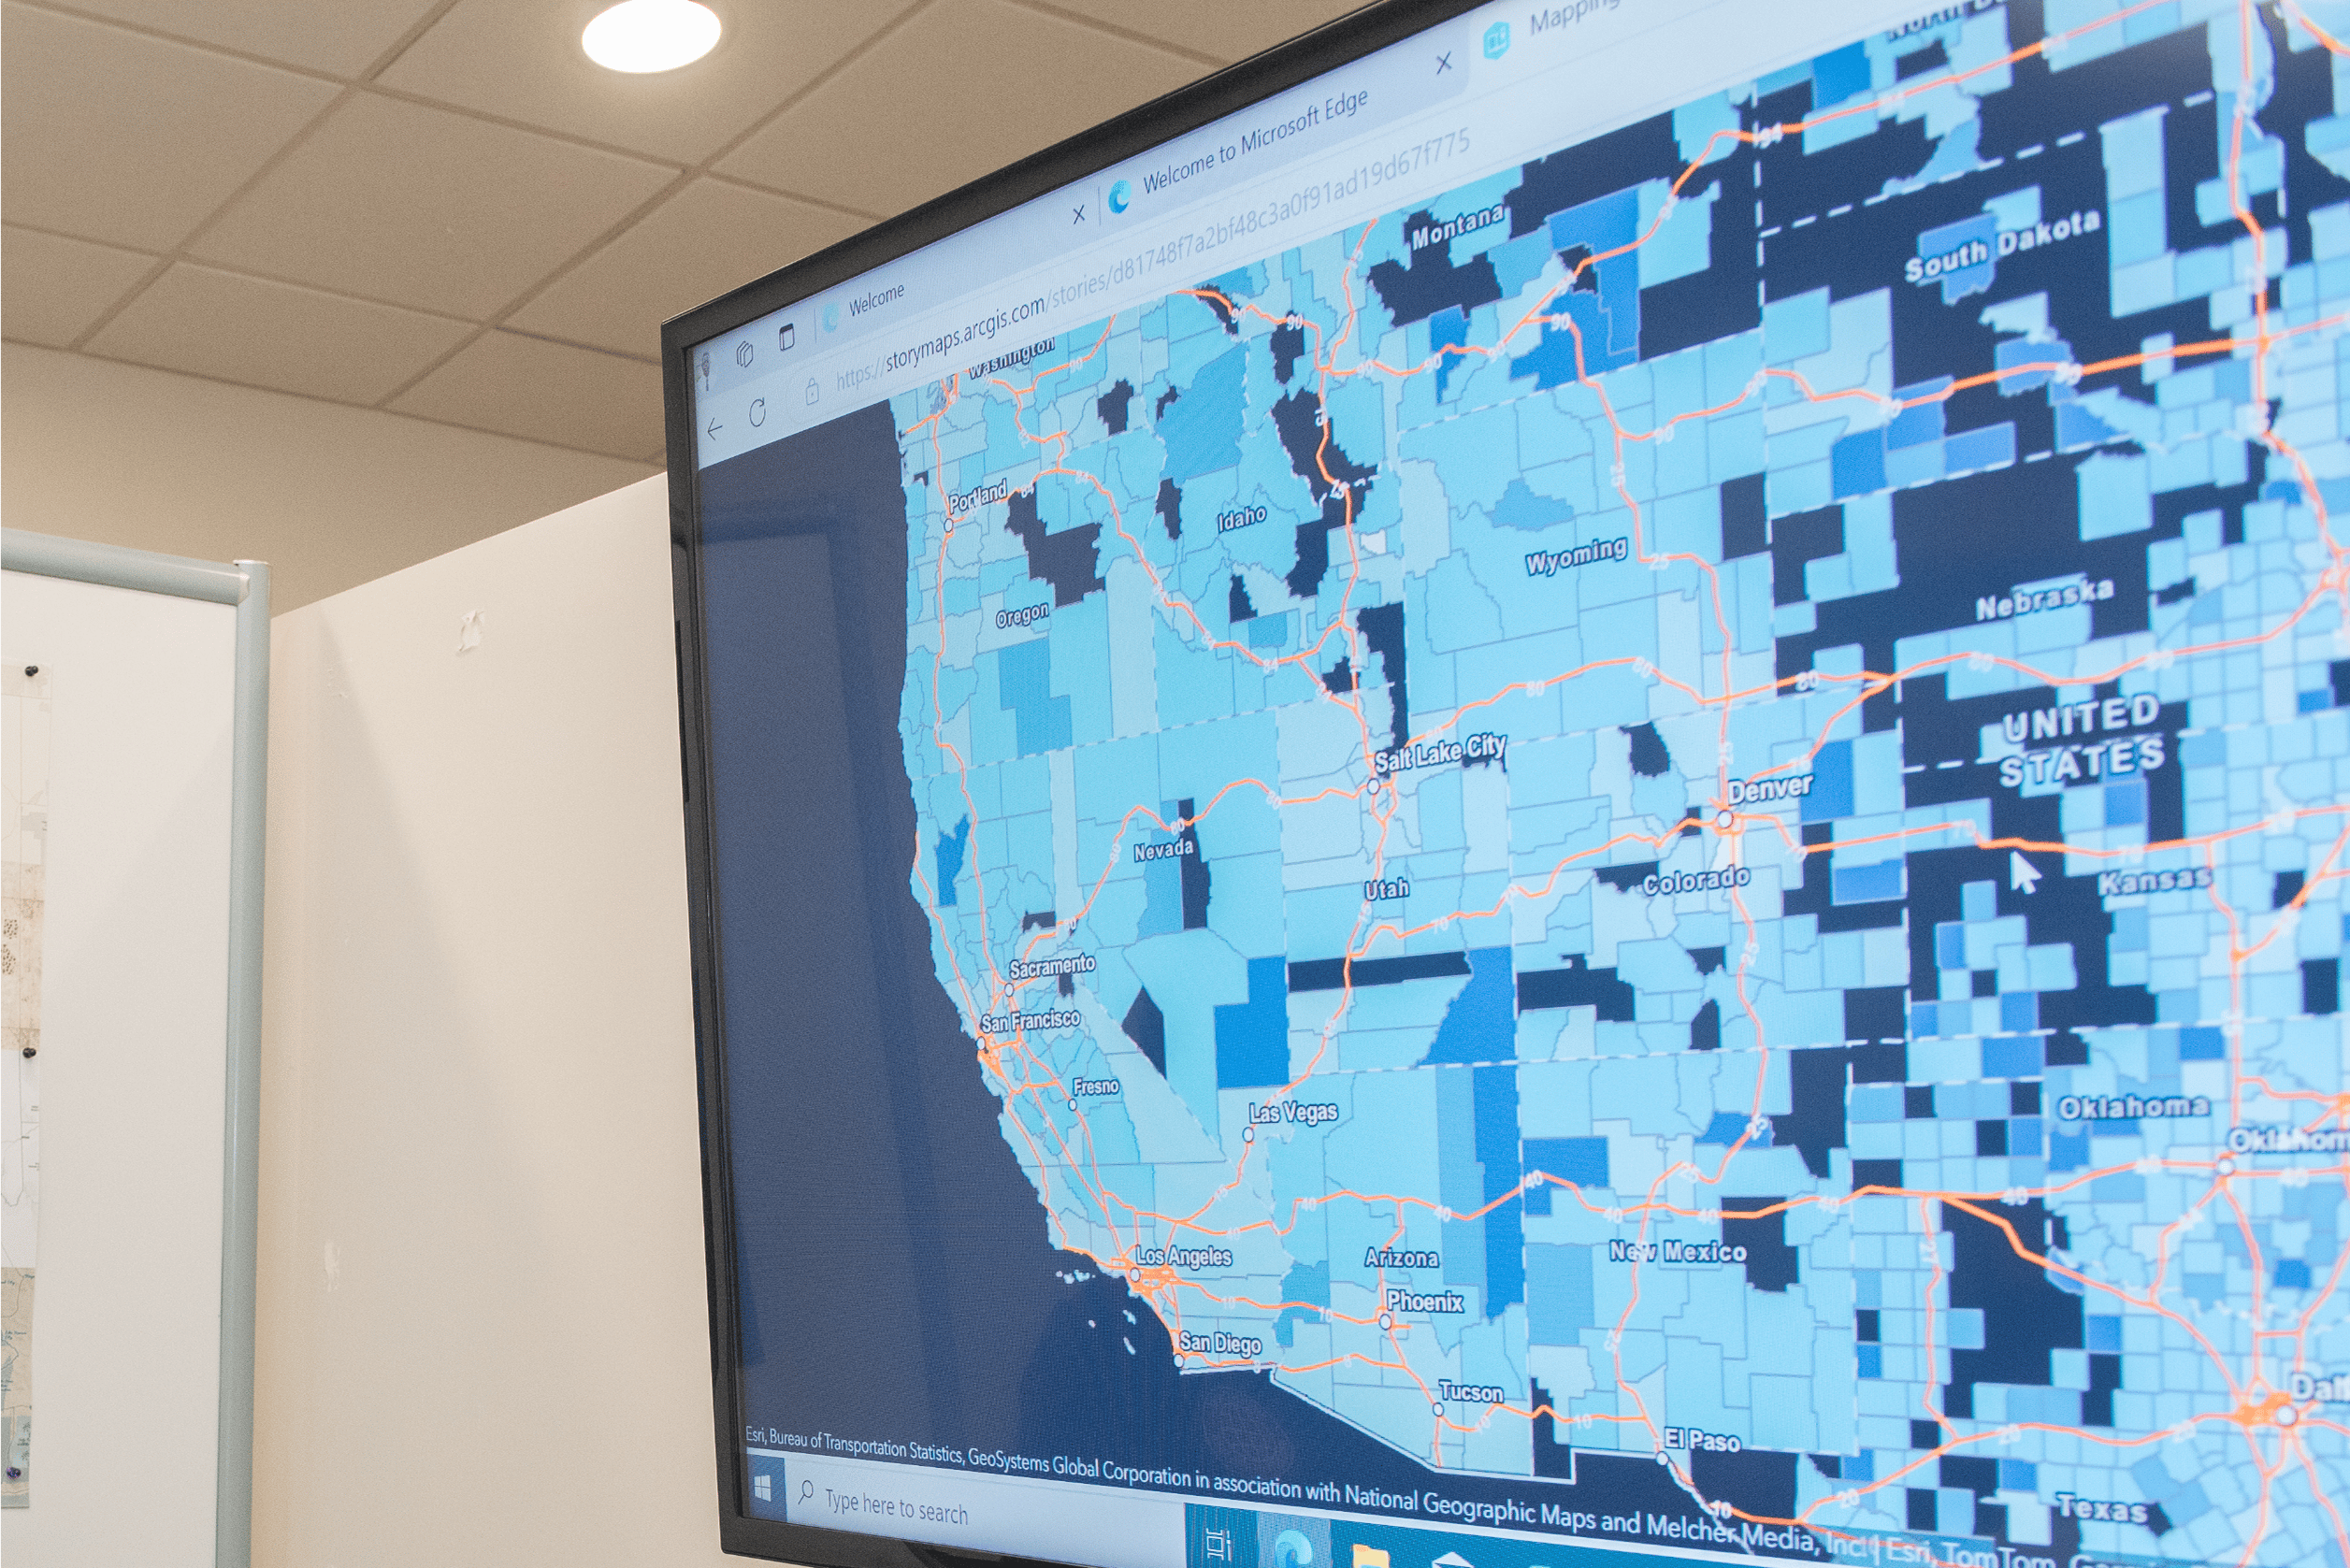
Real tools, real impact — helping people and building stronger communities


Real tools, real impact — helping people and building stronger communities
Explore our collection of student portfolios to see how University of Redlands students apply GIS and storytelling through ArcGIS StoryMaps. These projects demonstrate the integration of spatial analysis and narrative to address real-world issues, reflecting the interdisciplinary and applied nature of their academic work.
GIS Programs and Initiatives at Redlands
Institute for Geospatial Impact (IGI)
IGI supports GIS education, interdisciplinary research, and community-based projects. It connects students with internships, career opportunities, and campus-wide applications.
Department of Geographic Information Science (GIS)
The Department of GIS offers a personalized GIS graduate education in Redlands, California, home to the world's leading GIS company, Esri.
Center for Spatial Business (CSB)
The CSB advances GIS and spatial thinking in business through research, education, curriculum innovation, and strategic partnerships.
Take your next steps
Endless opportunities are waiting for you at Redlands.