

Esri User Conference 2026
Off-campus Jul 11, 2026 - Jul 16, 2026 All Day All
About the Event
The Esri User Conference (Esri UC), held annually in San Diego, California, is the world’s largest gathering of Geographic Information System (GIS) professionals. This premier event brings together experts and practitioners from a wide range of industries to explore the latest innovations in GIS technology, exchange best practices, and build valuable professional networks. The conference's theme this year is:
GIS – Creating a more intelligent world
"Geographic information system (GIS) technology creates a more intelligent world by turning the science of “where” into shared understanding and coordinated action—at the scale of communities, enterprises, and the planet." –Esri
Visit us at our Expo Booth #1913
Esri User Conference Student Assistants
Congratulations to the following University of Redlands students and recent alumni who were selected to be Student Assistants at this year’s User Conference. Look for them at the Convention Center!
- Alexander Moore, Geographical Information Systems, B.A. ‘26
- Archit Srivastava, Geographical Information Systems, M.S. ‘26
- Chloe Wernher, Computer Science, B.S. ‘26
- Karin Vandenburgh, Computer Science, B.S. ‘26
- William Coziahr, Computer Science, B.S. ‘27
For details, contact the GIS Department gis@redlands.edu or the Institute for Geospatial Impact igi@redlands.edu
University of Redlands Conference Schedule
Saturday, July 11 & Sunday, July 12 – Safety & Security Summit Table #17 |
|
7:00 a.m. – 6:00 p.m
|
Indigo Foyer, Hilton San Diego Bayfront |
|
7:00 a.m. – 3:00 p.m |
Indigo Foyer, Hilton San Diego Bayfront |
Saturday, July 11 & Sunday, July 12 – Education Summit Booth #A110 |
|
1:00 p.m. – 2:00 p.m
|
"Mapping Everything: Applying a Spatial Lens Across Environment and Culture”John Glover (Professor of History, Undergraduate Advisor for GIS) - Mapping Metal: Applying GIS to a Global History of a Music GenreGrand Ballroom Salon 3, Marriott Marquis |
1:00 p.m. – 2:00 p.m
|
"Shaping the Future of GIS Education”Julia Lenhardt (Director of Geospatial Technology, University of Redlands), Sam Moore (CTE Pathway Lead, Arroyo Valley High School San Bernardino City Unified School District) - Data-Driven Decision Making in a K–12–University GIS PartnershipGrand Ballroom Salon 4, Marriott Marquis |
July 13 to July 16 – Esri User Conference
Visit us at our booth #1913 for an invitation to an exclusive event!
Monday, July 13 |
|
3:30 p.m. – 5:00 p.m. |
Academic GIS Fair, Booth A110San Diego Convention Center, Upper Level/ Sails Pavilion – Ballroom 20 Foyer |
4:00 p.m. – 6:30 p.m. |
Map Gallery ReceptionSan Diego Convention Center, Upper Level/ Sails Pavilion – See below for Map Gallery entries |
Tuesday, July 14 |
|
8:00 a.m. – 6:00 p.m. |
Map GallerySan Diego Convention Center, Upper Level/ Sails Pavilion |
9:00 a.m. – 6:00 p.m. |
Expo Booth #1913San Diego Convention Center, Ground Level Exhibit Hall |
Wednesday, July 15 |
|
8:00 a.m. – 6:00 p.m. |
Map GallerySan Diego Convention Center, Upper Level/ Sails Pavilion |
9:00 a.m. – 6:00 p.m. |
Expo Booth #1913San Diego Convention Center, Ground Level Exhibit Hall |
6:00 p.m. – 8:00 p.m. |
University of Redlands Reception – Alumni & FriendsUnion Kitchen & Tap Gaslamp Quarter |
Thursday, July 16 |
|
8:00 a.m. – 1:30 p.m. |
Map GallerySan Diego Convention Center, Upper Level/ Sails Pavilion |
9:00 a.m. – 4:00 p.m. |
Expo Booth #1913San Diego Convention Center, Ground Level Exhibit Hall |
Affiliated Departments
Institute for Geospatial ImpactContact For More Info
igi@redlands.eduUofR Map Gallery Entries
A collection of StoryMaps, posters, and dashboards.
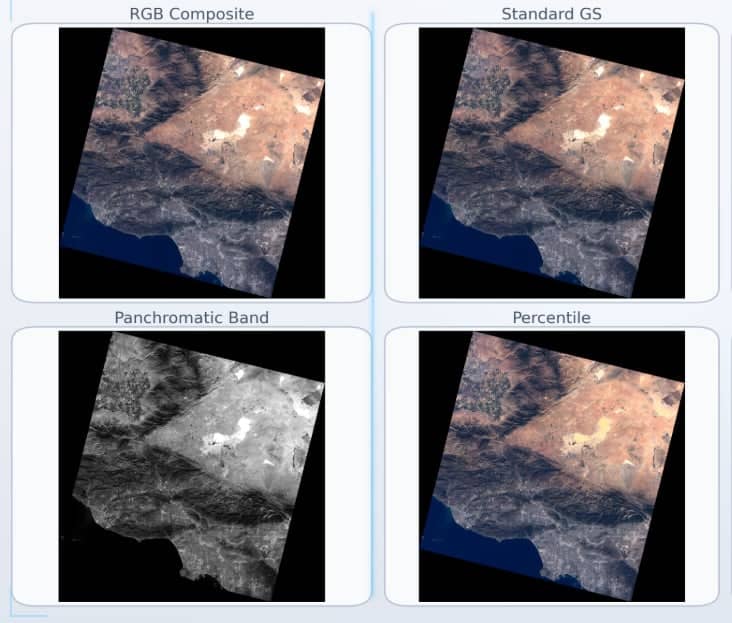
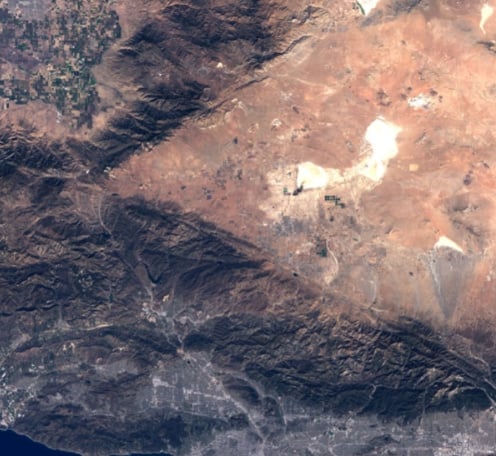
Evaluation of Gram-Schmidt Pan-Sharpening Methods by Archit Srivastava, MS GIS ‘26
StoryMap | An evaluation of Gram-Schmidt pan-sharpening methods using remote sensing imagery. It compares the standard Gram-Schmidt approach with radiometric normalization variations, including Min-Max scaling, percentile-based normalization, and histogram matching. The project examines how these preprocessing choices affect visual quality, spatial detail, contrast, and spectral consistency in pan-sharpened imagery. The results show that all methods improve spatial resolution, while percentile-based normalization and histogram matching provide more stable and balanced outputs where spectral consistency is important.
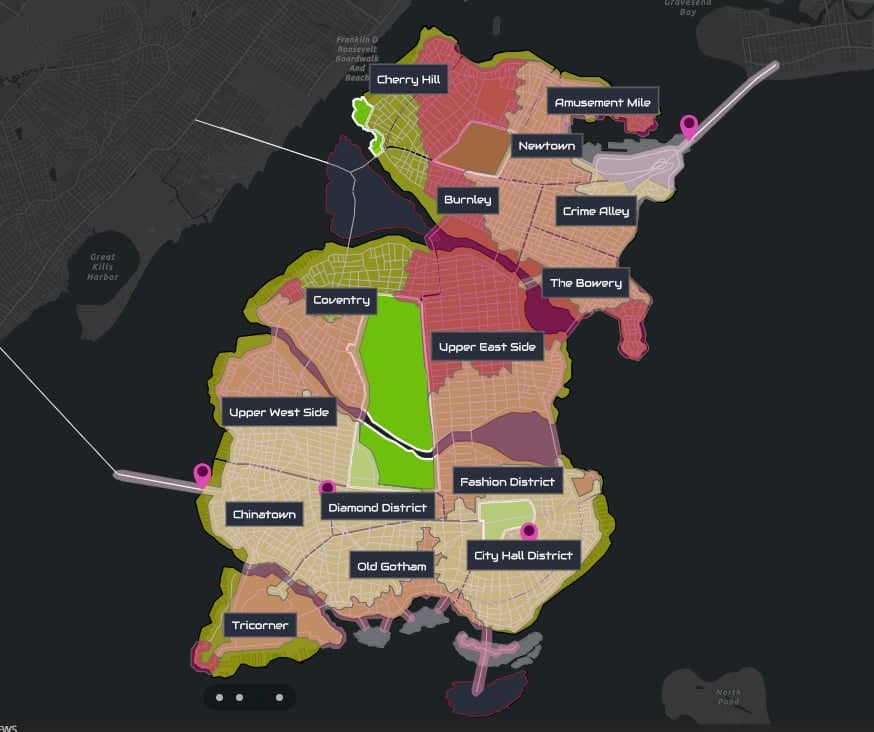
Gotham City Emergency Evacuation and Response Guide by Khouri Evans-Dangerfield, MS GIS ‘26
StoryMap | A project based on Detective Comics' Gotham City, as well as real-life emergency response guides. This project is meant to replicate emergency response plans in the Gotham City landscape in the event of a villainous attack. I created the map of Gotham City based on Eliot R. Brown's original map (with a few creative liberties) and, with the help of Dr. William Wagner, created a Network Dataset for the analysis in the project. Fair warning: the maps are not 100% comic book accurate; some locations were shifted or fabricated to make a more cohesive map.
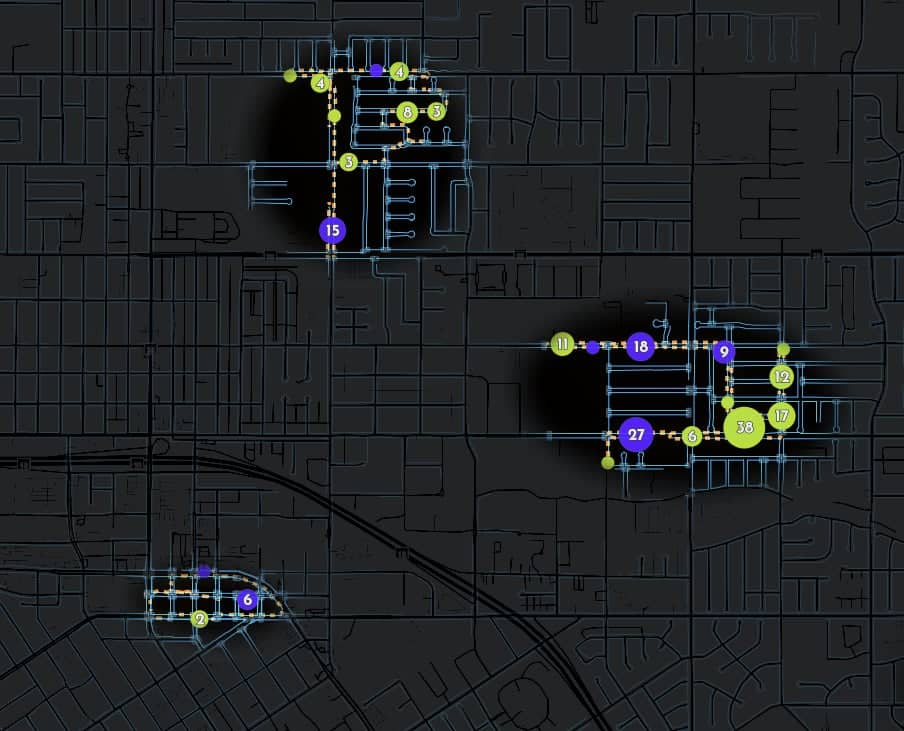
Where can we make pedestrian travel safer in Redlands? by Nicholas "Nico" Mora, MGIS ‘26
StoryMap | Between October and December 2025, field audits were conducted of sidewalks in three neighborhoods in Redlands, California, identifying locations with vertical fault defects. The audit results underscore that sidewalk conditions can vary substantially within the same town—even within the same 500-foot radius.