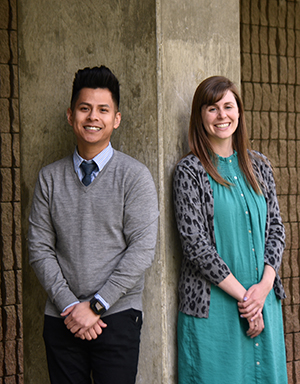
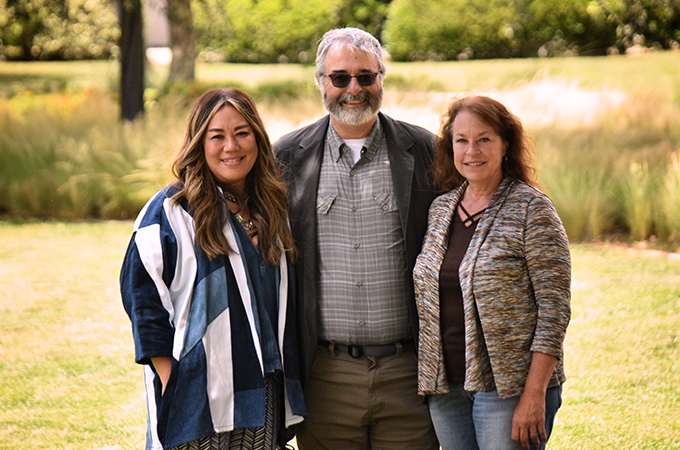
What is educational justice and how can it be measured? University of Redlands School of Education Associate Dean Hideko Sera, Center for Spatial Studies Director Steve Moore, and Spatial Resources Manager Lisa Benvenuti recently collaborated to look for answers to this question. In July, the trio will present their findings at the Esri User Conference Education Summit.
“Educational justice requires us to think about issues of access, equity, quality, resources and other critical elements that impact one’s learning process,” says Sera. “In the School of Education, there is an overarching commitment to this idea. We have received anecdotal reports from students saying that they are doing this work, but we wanted to figure out how to quantify it.”
Every graduate student in the School of Education’s department of teaching and learning is required to complete a certain number of fieldwork hours. Whether those hours are spent working as a student teacher or an intern, fieldwork gives students the opportunity to gain real-world experience in classrooms or other educational environments.
Sera and her colleagues in the School of Education Office of Student Success began to ask questions: Which communities are students working in? What are the predominant demographic characteristics of these communities? Are students being agents of change by going into communities with diverse challenges and struggles?
Sera wondered if visualizing the education data on a map could help clarify the answers and reached out to Moore for help. Using ArcGIS Pro and other GIS tools, Benvenuti and Moore created a map of Southern California that identified disadvantaged schools where U of R students were getting placed and the relationship between the two.
“In deciding which variables to measure [to identify disadvantaged schools], we looked at language, ethnicity, income, government assistance, crime concentration, and more to see how those factors affect the region,” says Moore. “Lisa also created a risk index for schools based variable such as the percentage of students in free and reduced lunch programs, truancy absence rates, and whether or not students are passing state-level English and Math tests.”
The project, titled “Using GIS to Evaluate the Educational Justice of Student Teaching Placements,” offers a number of insights. First, the map proves that the School of Education is sending students to work in communities where they are needed, which, Sera says, is one of the most rewarding aspects of the project. It also outlines areas that should be supported in the future. The Office of Student Success is planning to use the map to determine where to place students.

“Students have told us that they enroll in our programs because of the focus on educational justice,” says Sera. “These stories are important, and having the data to back them up is critical.”
In addition to gaining insights for the School of Education, Sera and Moore both note that they found the collaboration valuable professionally. Moore, who has applied GIS to education in previous projects, says that this one has further convinced him to focus on how physical and social environments impact schools and their students. A novice in GIS programs, Sera adds that the project encouraged her to think in a multidimensional way to find holistic solutions to issues in education.
“We often seek solutions outside of our workplace. Perhaps projects like this will encourage others to collaborate in interdisciplinary ways to further deepen our work at the University,” says Sera.
The group is eager to present at the Esri User Conference Education Summit in San Diego in July. The annual summit serves as a gathering place for educators and GIS professionals, and hundreds of posters and talks will be presented during the three-day event. Moore and Sera say their work is unique.
“This collaboration demonstrates how the U of R can operate as a spatial institution,” says Moore. “We’re leveraging our unique advantages to improve how we educate our students and impact education outcomes in the schools and districts we work with. Not only is it an evaluation—it’s a model of how spatial analysis can foster collaborations across campus and deepen the work that we do.”
Learn more about the Center for Spatial Studies, the School of Education, and attend U of R presentations at the Esri User Conference.


