University of Redlands
 Logging in to Insights for ArcGIS
Insights for ArcGIS is a new web app that allows users to perform iterative and exploratory data analysis of both spatial and non-spatial data. Insights introduces a new paradigm for data exploration that is visually-oriented, intuitive, and responsive. Because it is integrated with the ArcGIS platform, Insights provides many powerful tools that GIS users are familiar with such as spatial aggregation, summarization, proximity, statistical, and pattern analysis. To sum up, Insights is a powerful and intuitive GIS tool offered completely through a web browser!
To learn more visit, https://doc.arcgis.com/en/insights/
1) Login to your program's ArcGIS Online portal - Either univredlands or redlandsbusiness. If you have never logged in or need help with this, please follow the steps detailed at this link.
2) Click the Apps button (9 little squares) at the top-right of the page and click the Insights icon.*If you have never logged in (or haven't logged in for more than a year), it may take a few minutes for your Insights license to be granted so try refreshing the site for a few minutes. If you do not receive access within 15 minutes of activating your account, please contact us for assistance.
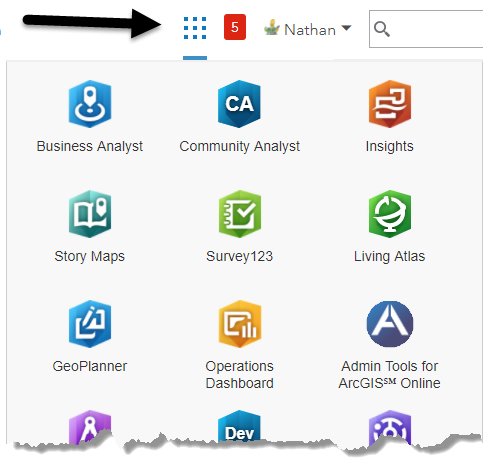 *Your apps may be in a different order than the screenshot. You may rearrange the apps however you like.
3) That's it! You are now logged in to Insights for ArcGIS.
Getting Started with Insights
Visit http://doc.arcgis.com/en/insights/online/get-started/quick-exercise-spatial-analysis.htm to step through Esri’s “Quick Exercise”. This exercise demonstrates some of the key features of Insights using the following scenario:
In this exercise, you are a business analyst for a consortium of colleges that wants to run a marketing campaign in states with high-value colleges. It's up to you to find states with colleges that have a good return on investment for students. You'll use Insights for ArcGIS to analyze United States Department of Education College Scorecard data in the form of a feature layer to find relationships between the cost of college and earnings by graduates. In 20 minutes or less, you will do the following:
Feel free to contact the Center for Spatial Studies at urspatial@redlands.edu with any problems or questions! We’re excited to hear your thoughts and ideas about Insights and how we can help!